
农业与林业
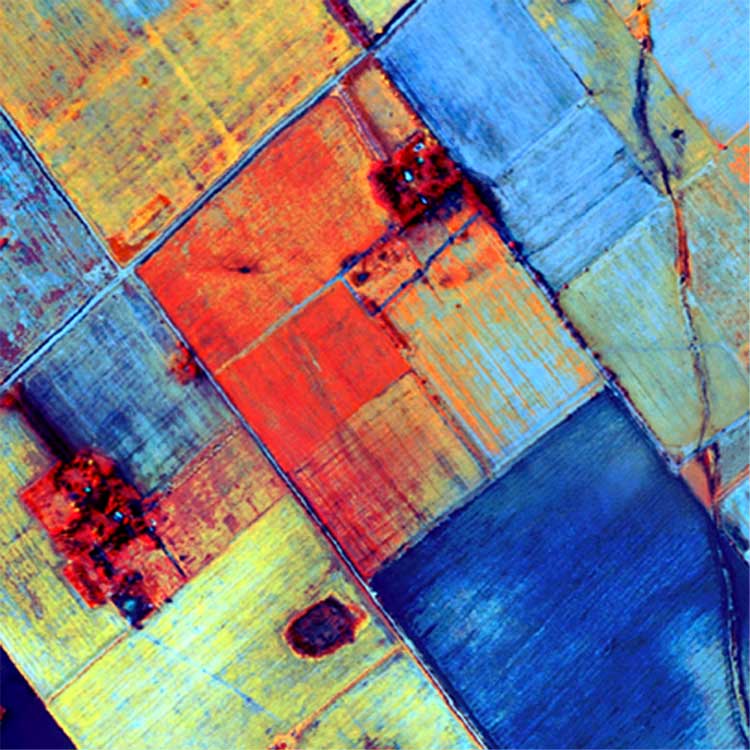
Hyperspectral and multispectral data is ideally suited for agricultural and forestry applications. Some of the uses of this technology include: soil type mapping, precision farming (evaluating the optimal use of irrigation, fertilization and pesticide treatments), crop yield prediction, illegal crop detection, monitoring of deforestation/reforestation programs, etc. It is fundamental to determine the land uses in order to plan de different exploitation activities of the natural resources. Hyperspectral and multispectral imagery provide detailed information in a very fast and efficient way. Besides, HytecAltoAmericas’ airborne imaging spectrometers offer higher spatial and spectral resolution than satellite imagery, to more precisely identify vegetative species and map their status.


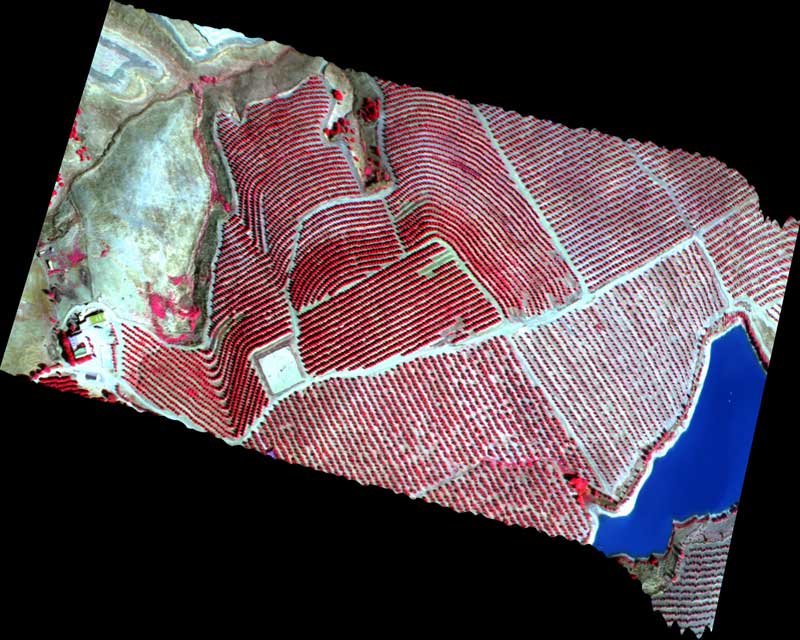
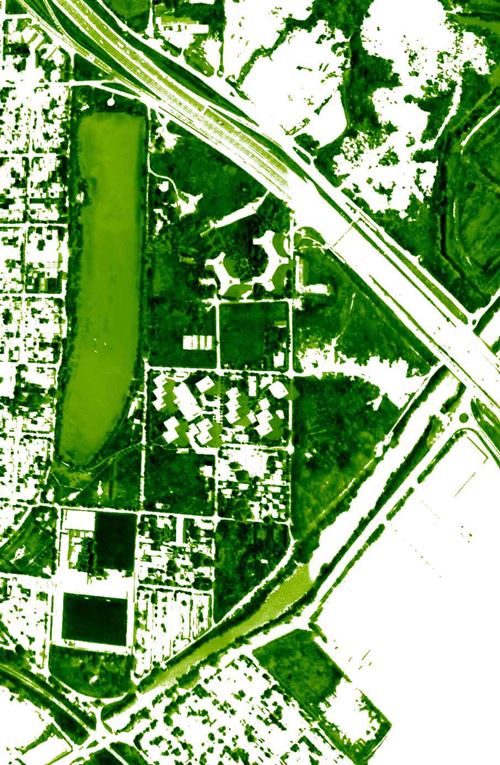
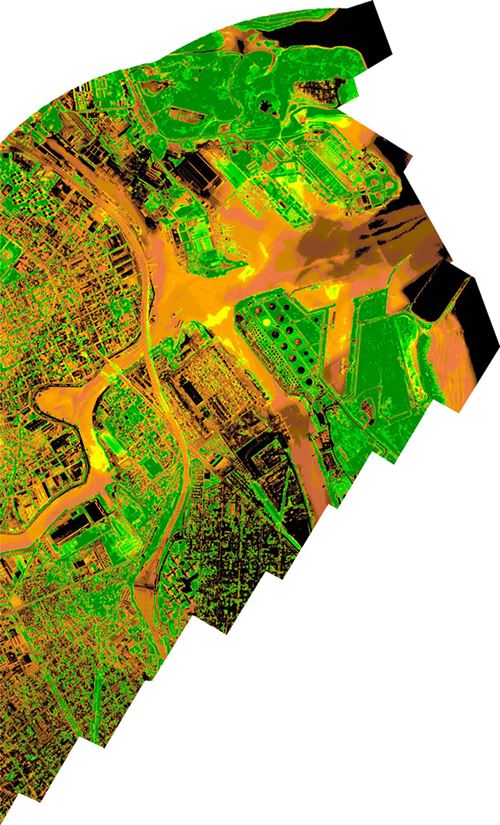
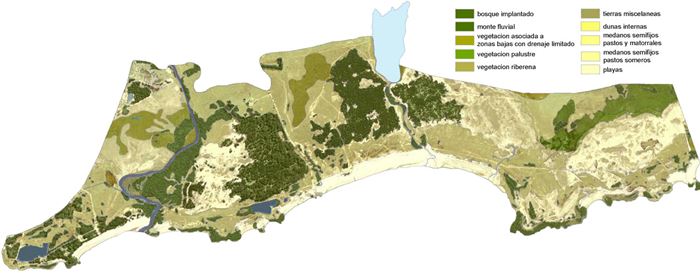
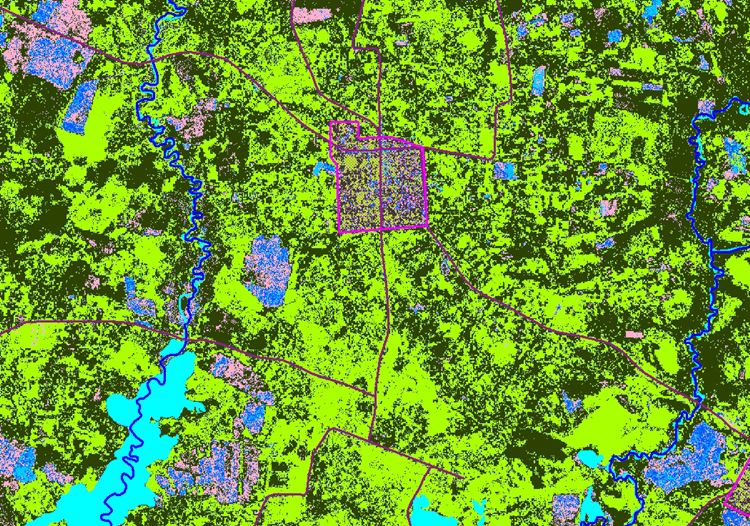
This map shows the type and spread of vegetation. It also identifies vegetation health, the different kinds of stress under which it may live because of different levels of contamination and their source. Hyperspectral imaging is also useful for species distribution and diversity studies, illegal crop detection, etc.


A hydrographic chart includes all surface water, such as lakes, ponds, rivers, wetlands, marshes, aquifers and glaciers, and identifies the corresponding basins.


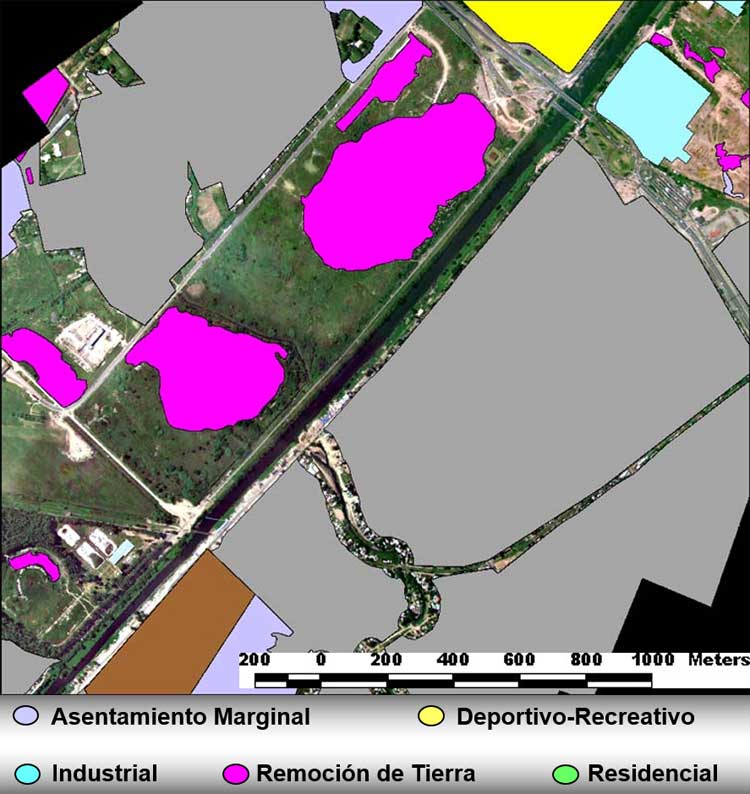
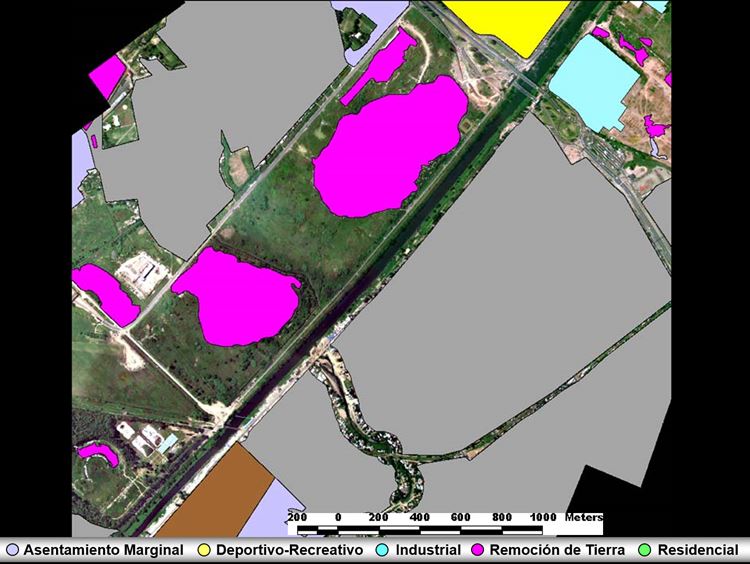
This product measures land erosion, which is one of the most important environmental variables to monitor in desertification processes.

This vectorial analysis determines the rate of elevation change. The slopes are generally derived from a digital elevation model. The resulting maps allow the calculation of water stream directions and their supposed velocities.

A surface stability analysis is developed from soil and lithological maps, and slope analysis core products. These composite maps are useful to civil engineers in the planning of dams and general infrastructure, and for pipeline, channel, and transportation network routing.

A transportation network map records all types of transportation pathways: highways, railroads, paved roads, gravel and dirt roads, paths, etc
An accessibility or trafficability map is developed from soil, lithological transportation network maps, and also from slope analysis. These maps show the ease of moving equipment and personnel from one location to another.
This map details the location of different services network and its respective facilities. It can include, for example, electric lines, microwaves transmission towers, irrigation canals, water pipe, oil and gas pipelines, cloaca, etc.


