
ENVIRONMENT
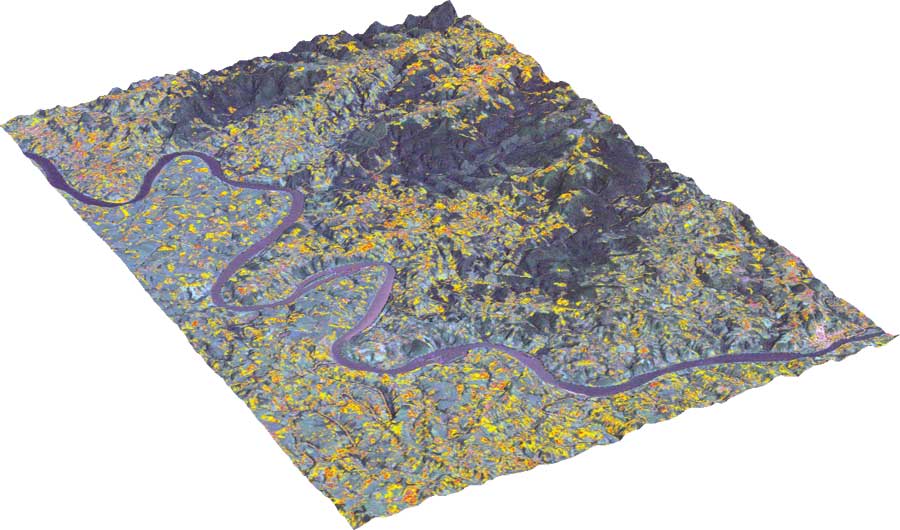
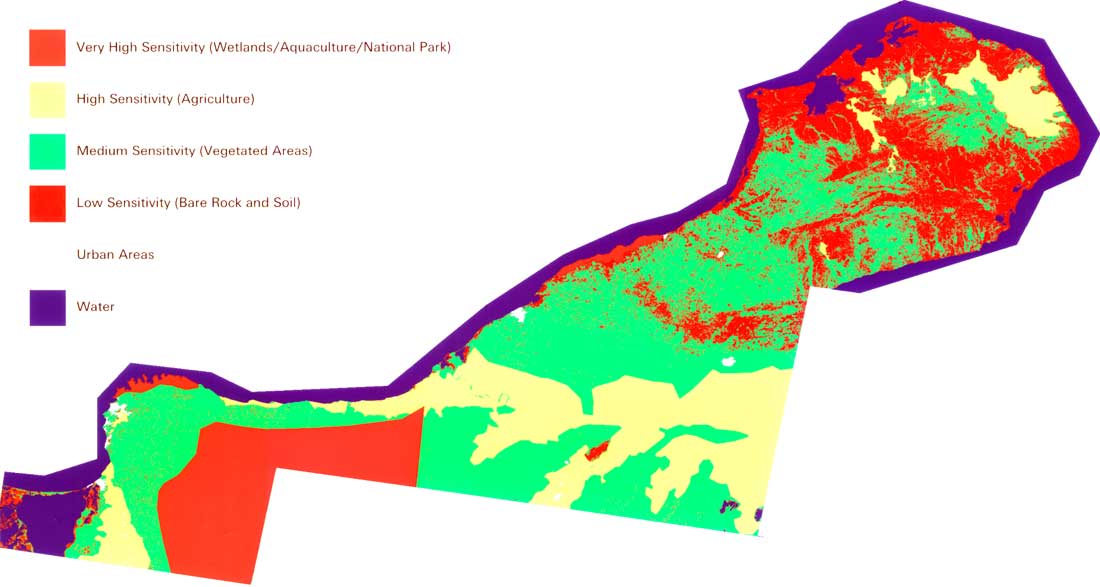
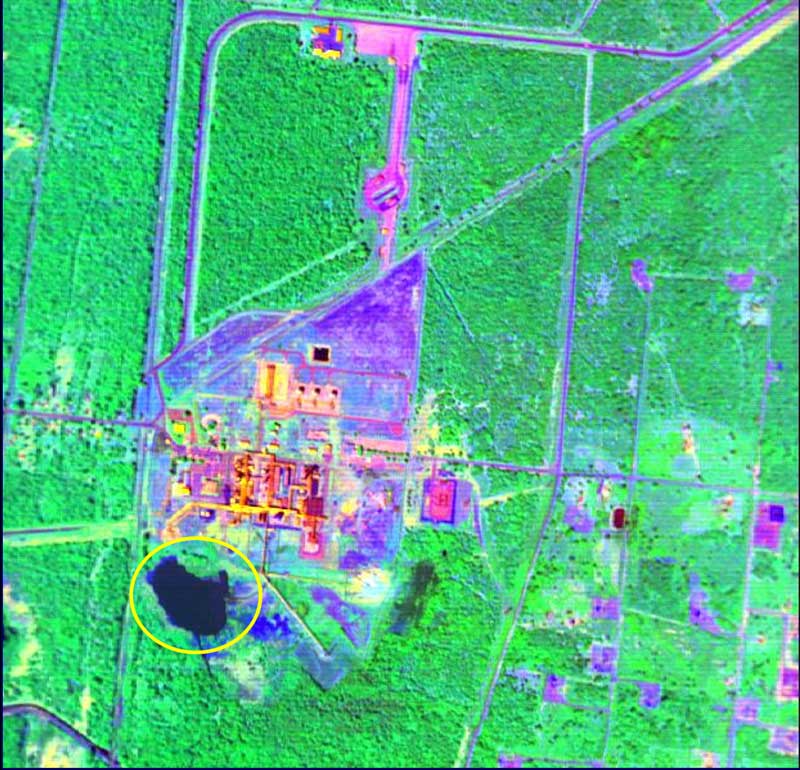
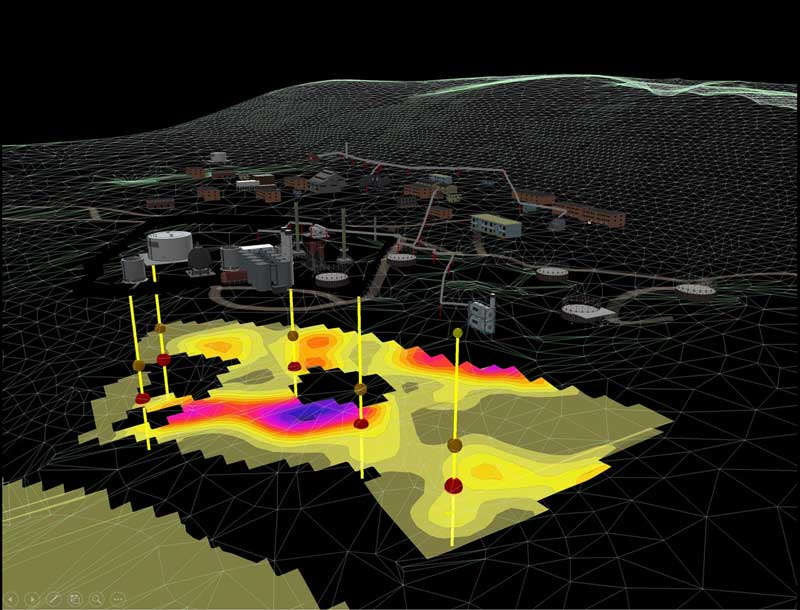
HytecAltoAmericas’ enhanced data enables our analysts not only to detect pollution, but also to differentiate its type, distribution and sources. We can also define the effects that contamination has on environment from observations of vegetation stress, chemical changes in soil and thermal variations in terrestrial surfaces and water bodies. Risk analysis maps are used to delineate areas sensitive to potential damage. Time-sequential studies characterize the evolution of ecosystems and habitats in regions of high environmental susceptibility. In order to carry out this kind of studies, it is possible to use the analysis of various environmental components, such as soil, vegetation and water bodies, among others. Also, multiple variables are analyzed, which may modify the physical and biological conditions of environment (weather phenomena, erosion levels, farming activities, population and urbanization, industrial installations, transportation network, etc.). Therefore, it is possible to determine the environmental baseline by quantifying the initial state of all of these components.
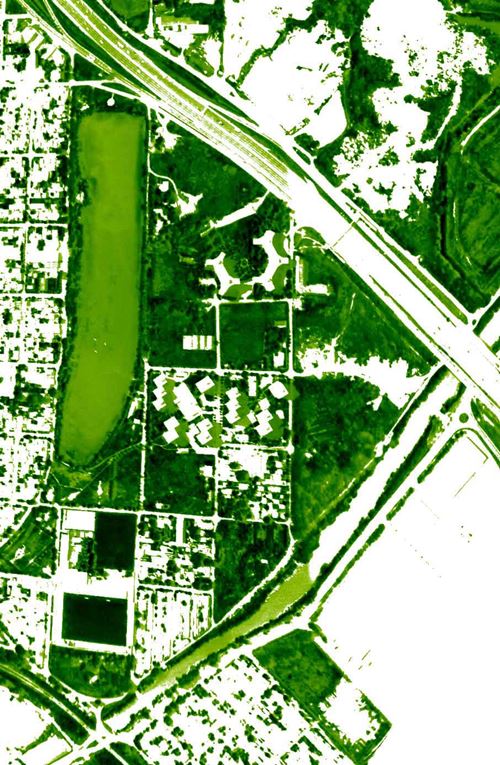
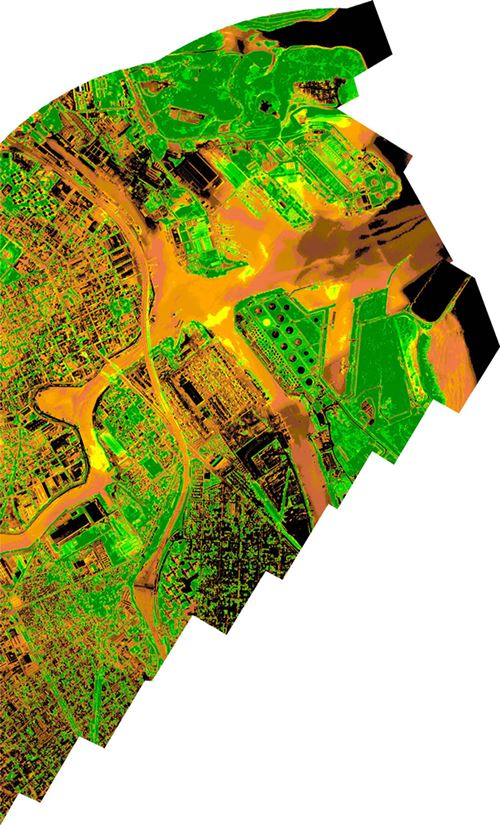
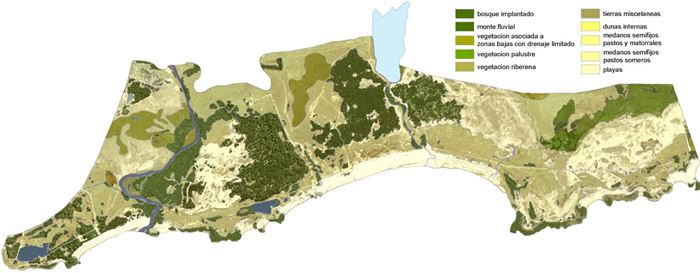
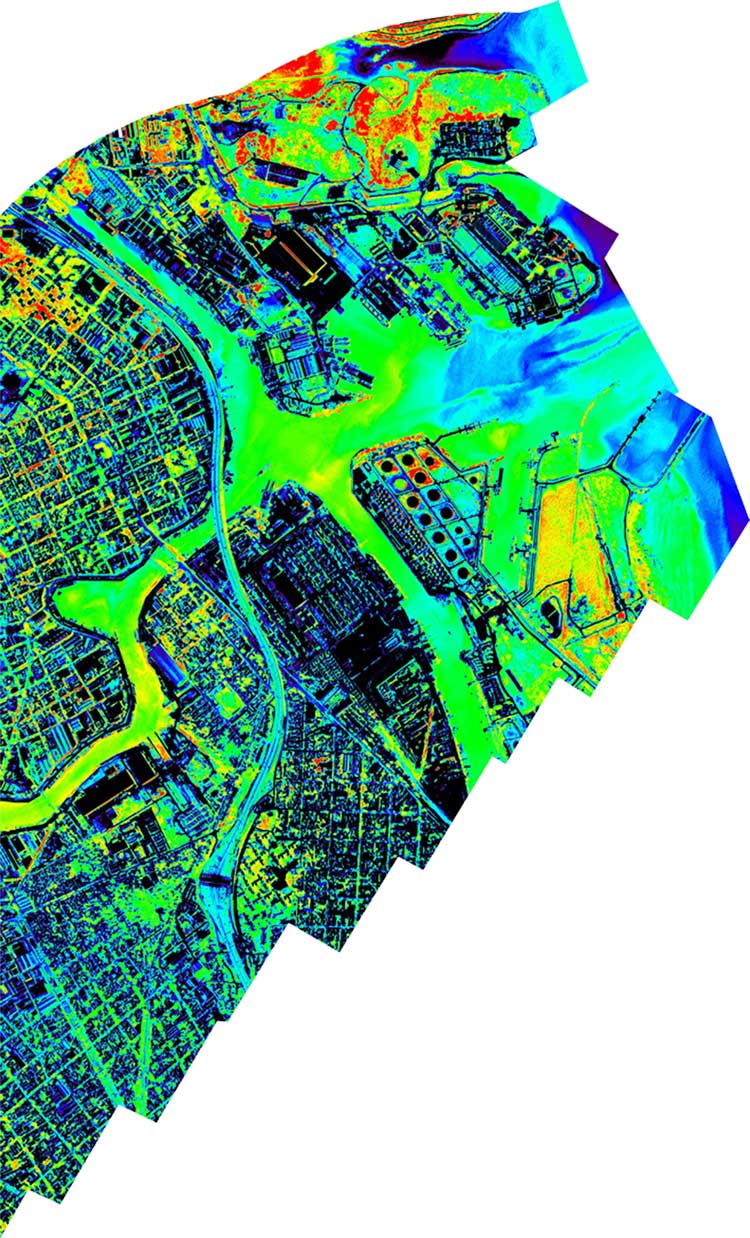
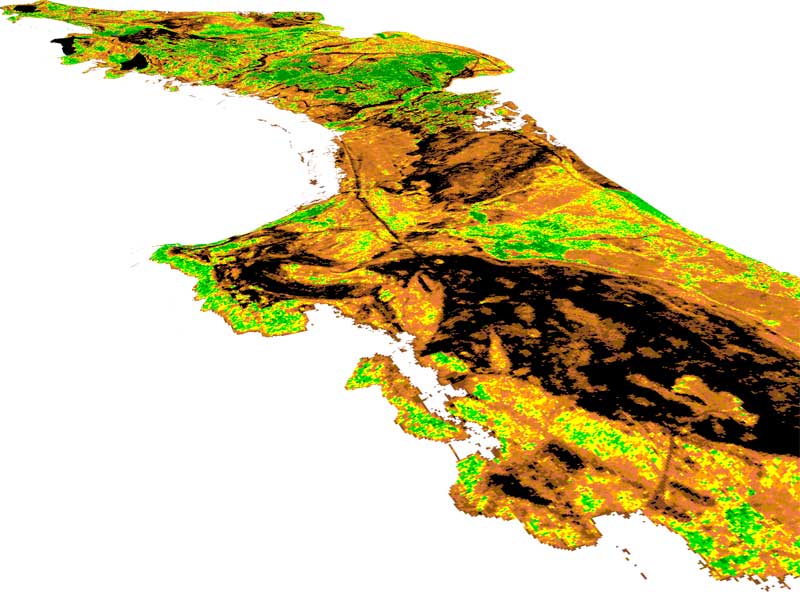
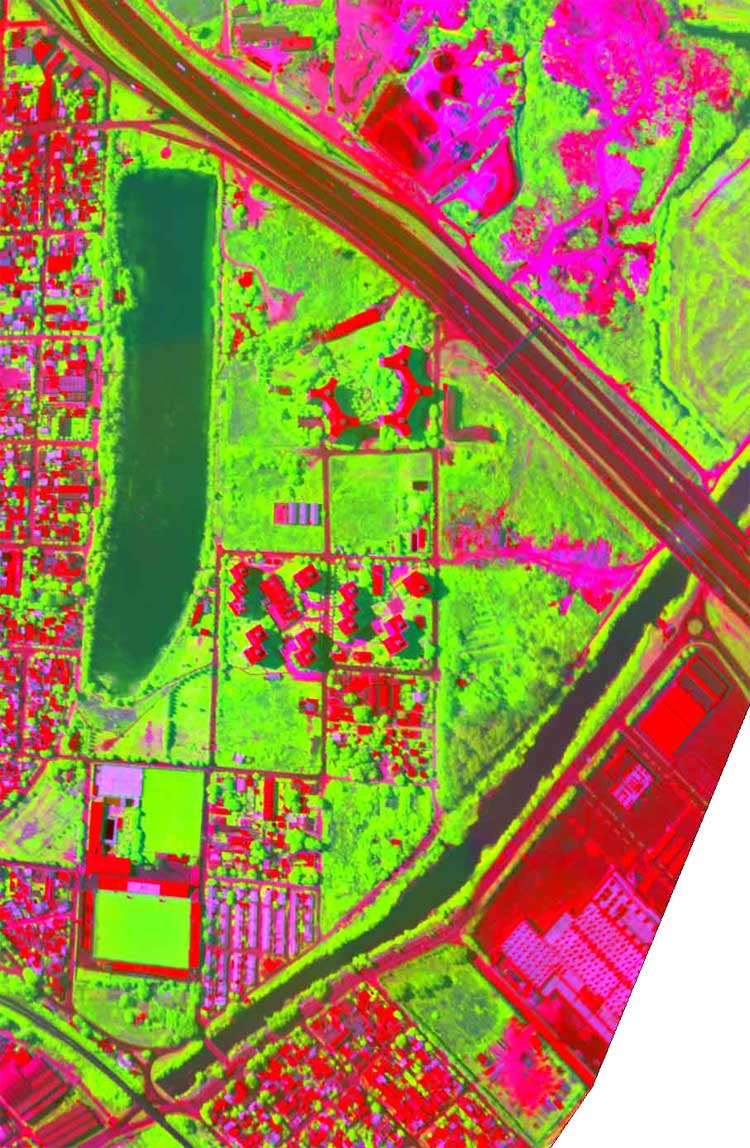
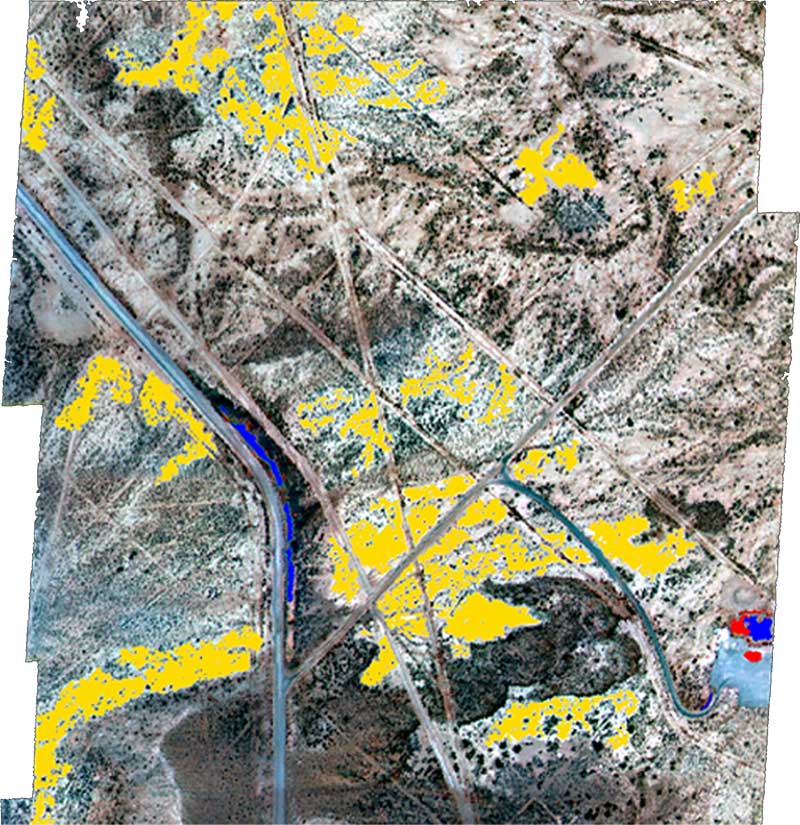
Vegetation maps show the type and spread of vegetation. It also identifies vegetation health, and the different kinds of stress under which it may live because of different levels of contamination due to hydrocarbons or other pollutants. Hyperspectral imaging is also useful for species distribution and diversity studies, illegal crop detection, etc.


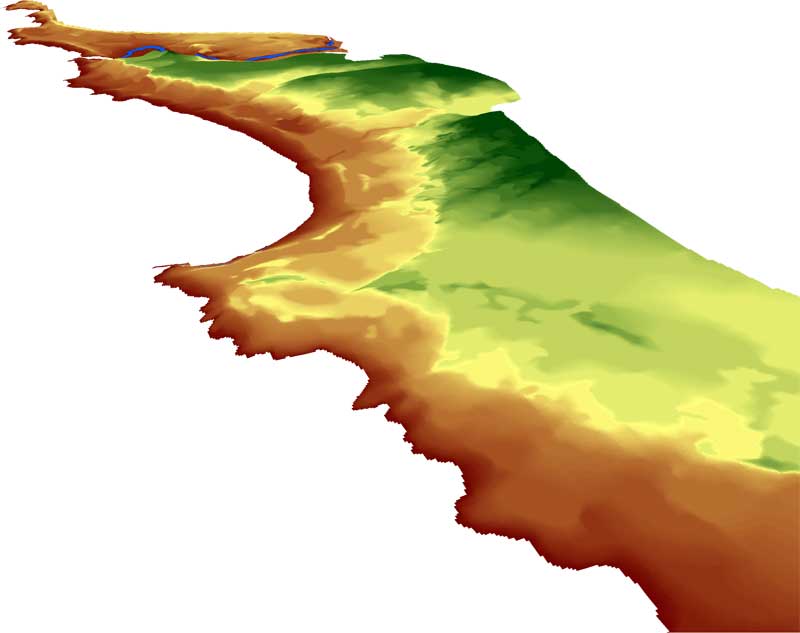
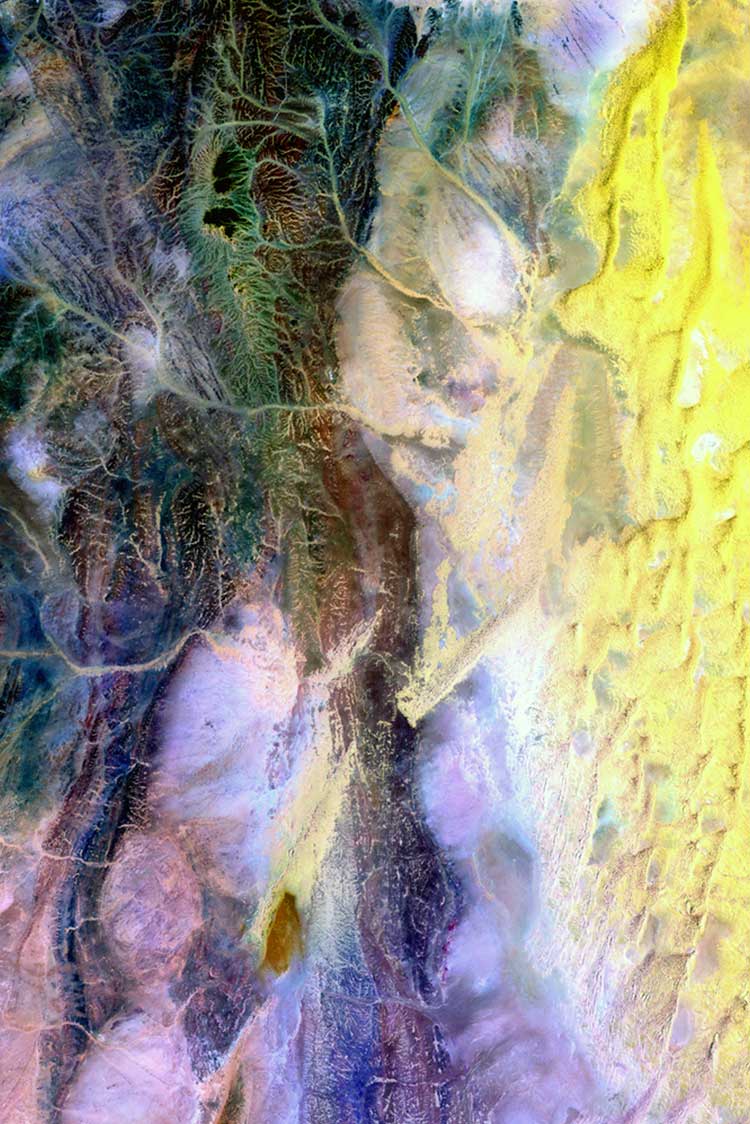
A hydrographic map includes all surface water, such as lakes, ponds, rivers, wetlands, marshes, aquifers and glaciers, and identifies the corresponding basins.


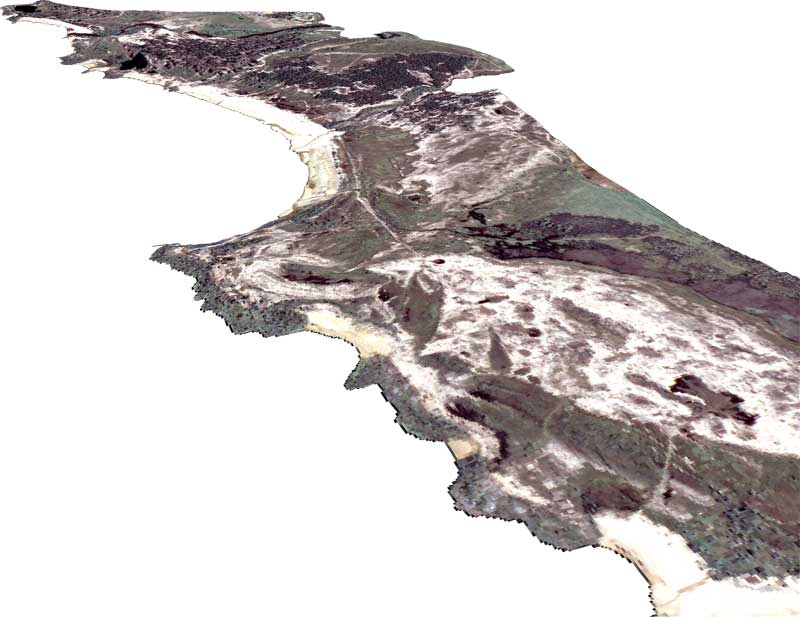
An environmental baseline is developed from crop, urbanization rate, vegetation, and hydrographic maps. It is designed to show the condition of the environmental variables in an area at a certain point in time, typically before the intrusion of industrial activities. In the development of a wide variety of industrial projects it is important to know the initial state of these variables, to be able to identify and quantify possible changes. Hyperspectral technology has been tested to be extremely useful for such studies in hydroelectric, mining and hydrocarbon projects.

This core product is a measure of how the resources of an area have changed over a period of time. This analysis is done by means of multi-temporal multispectral and hyperspectral, using several processing methods, such as simple image differencing, image regression, post-classification comparison, etc.


This product maps the extension and levels of damage on any area due to natural occurring disasters such as earthquakes, flows, twisters, volcanic eruptions, wildfires, etc. Agricultural and material losses are also estimated.


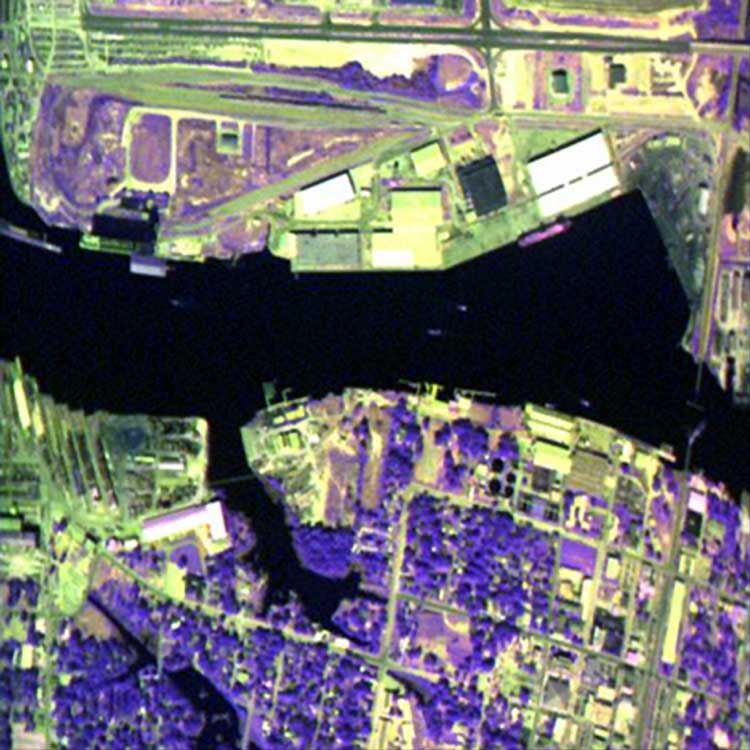
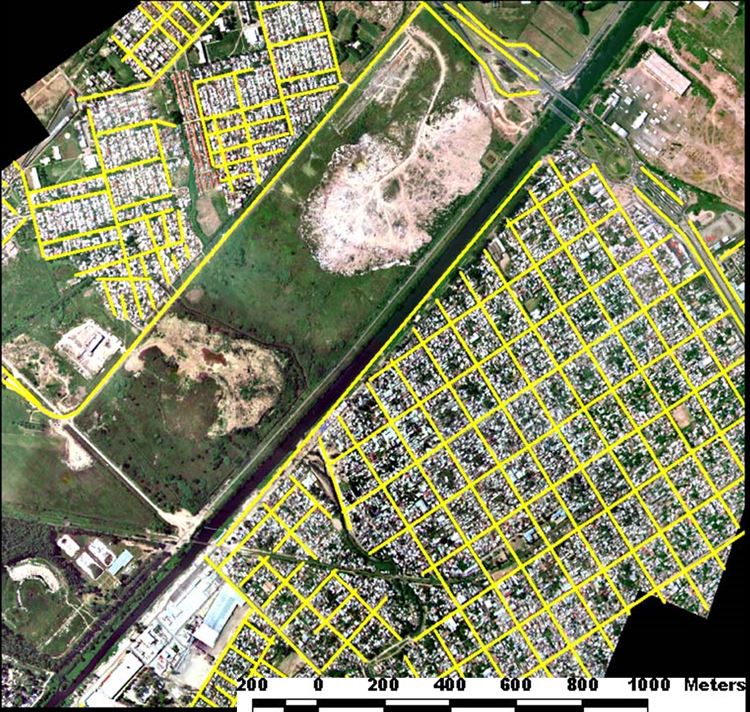
A population density map records population estimates that are not obtained directly, but are inferred by various methods. Dwelling-unit estimates are most useful in rural areas and third world countries. Land use and area density estimates are also used. In large cities, built-up techniques can be utilized.

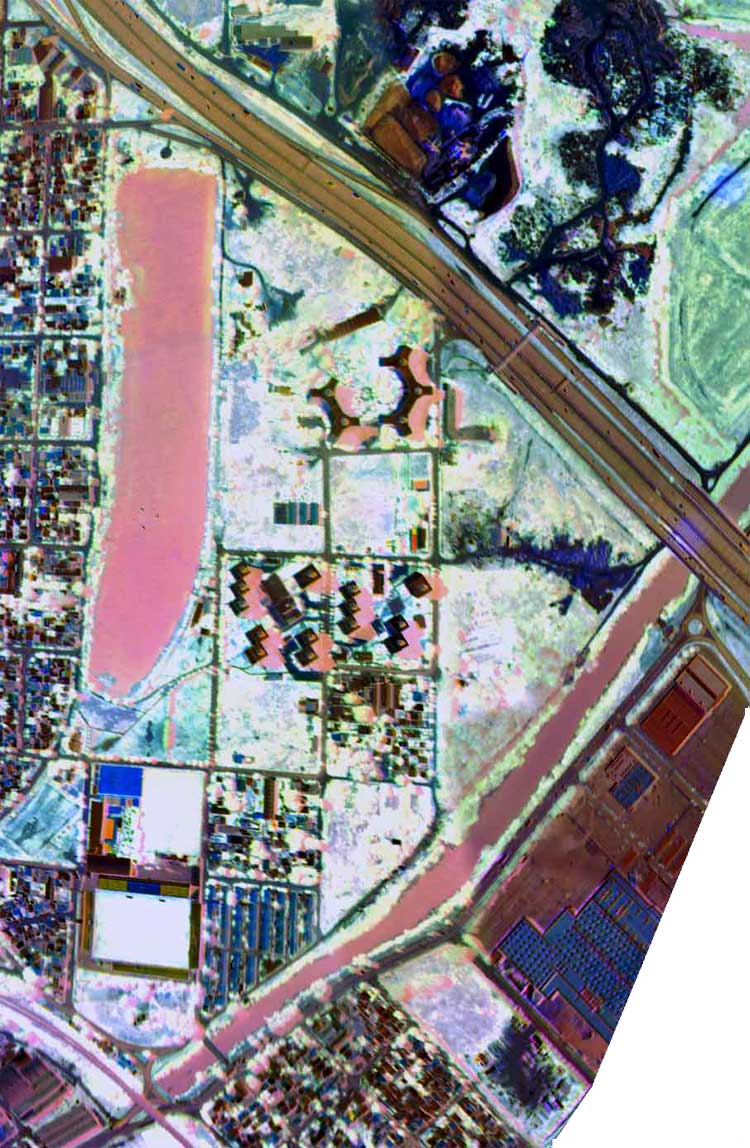
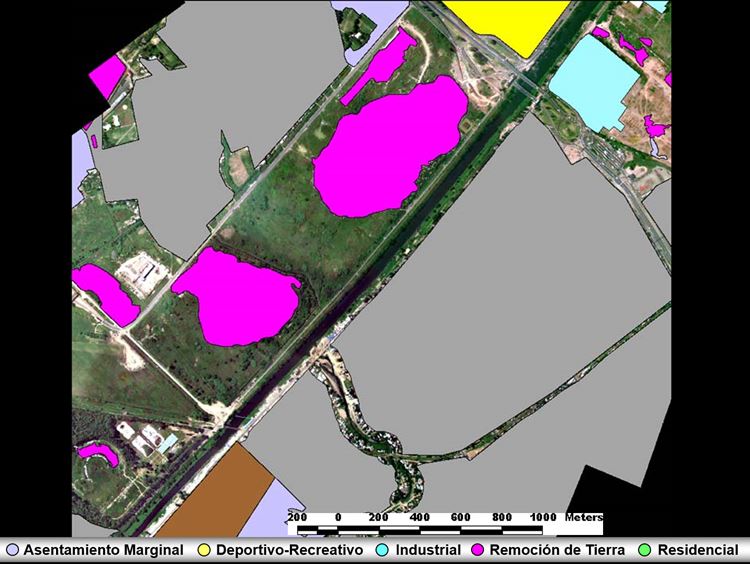
This can be considered a subvariety of the change detection product. Not only does it map urban areas, but it also compares them to previously available data, so as to identify changes and to estimate the urbanization rate.

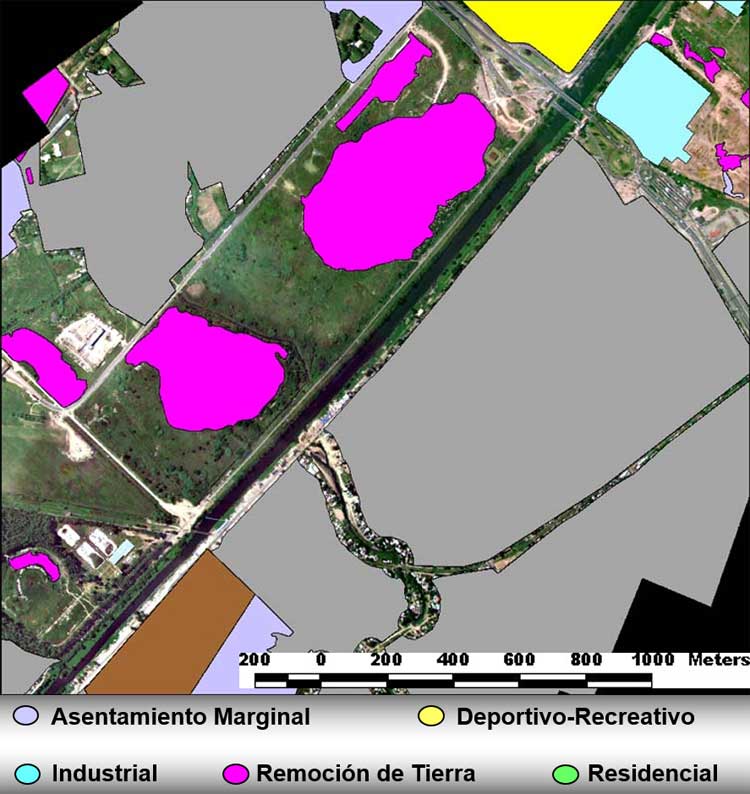
The settlement detection does not only identify marginal settlements, but also includes the comparison with previous data, in order to identify changes and know the urbanization rate.
