
MINING
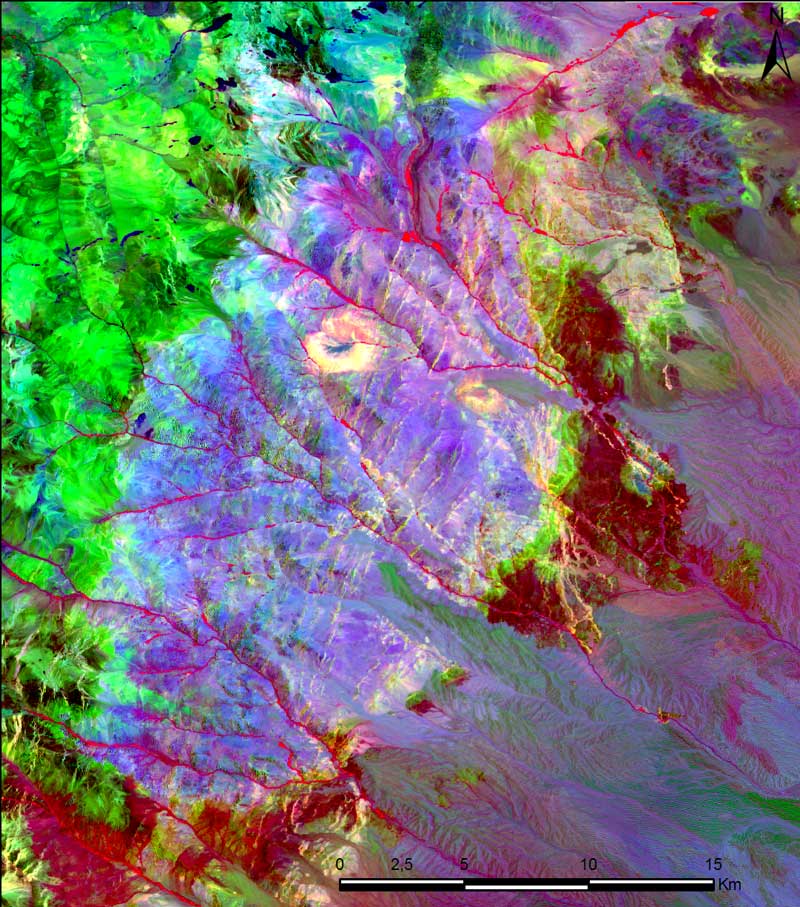
Remote sensing technology has been used extensively in mining exploration in order to define exploration targets, through the generation of lithological, mineralogical, structural and stratigraphic maps, among other products, so as to evaluate the logistics, determine the accessibility of an area, or to assess different grades of environmental impacts. This technology offers a wide range of possible products, either images or vectors in thematic layers compatible with Geographic Information Systems (G.I.S.), for display in 2-D or 3-D. The resulting maps can be delivered in almost any available digital format or printed in the required scale in high quality paper. Due to its better spatial and spectral resolution, the data that HytecAltoAmericas owns offer valuable tools to the geologist or engineer for a better understanding of the project in preliminary stages, increasing the effectiveness of fieldwork and providing assistance in the decision-making process in adverse situations.
During the prospection stages, a lot of information is generated –mineralogical, lithological, stratigraphic, structural, topographic, logistical, and environmental alterations, among others – which are then implemented in a Geographic Information System (S.I.G.). The data integration and analysis allow the generation of Prospectivity Maps, in which exploration targets are identified and categorized. This product has been designed specifically to help geologists and engineers during the evaluation and assessment of the mining potential of an area.

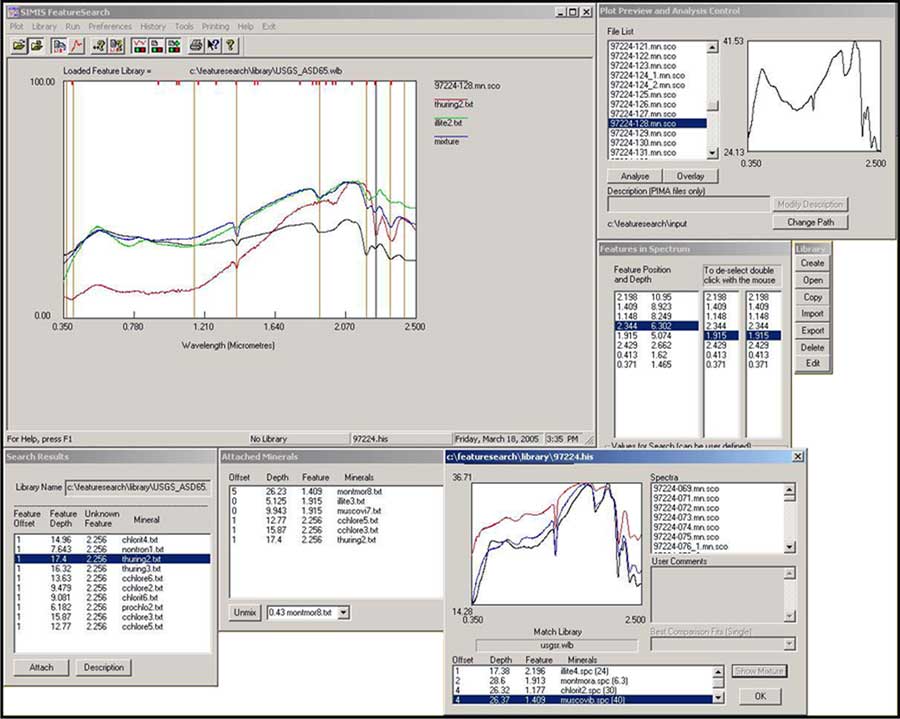
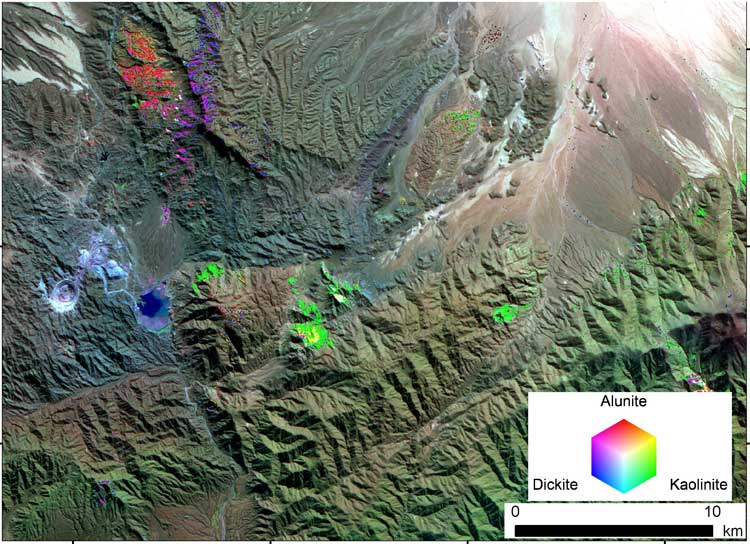
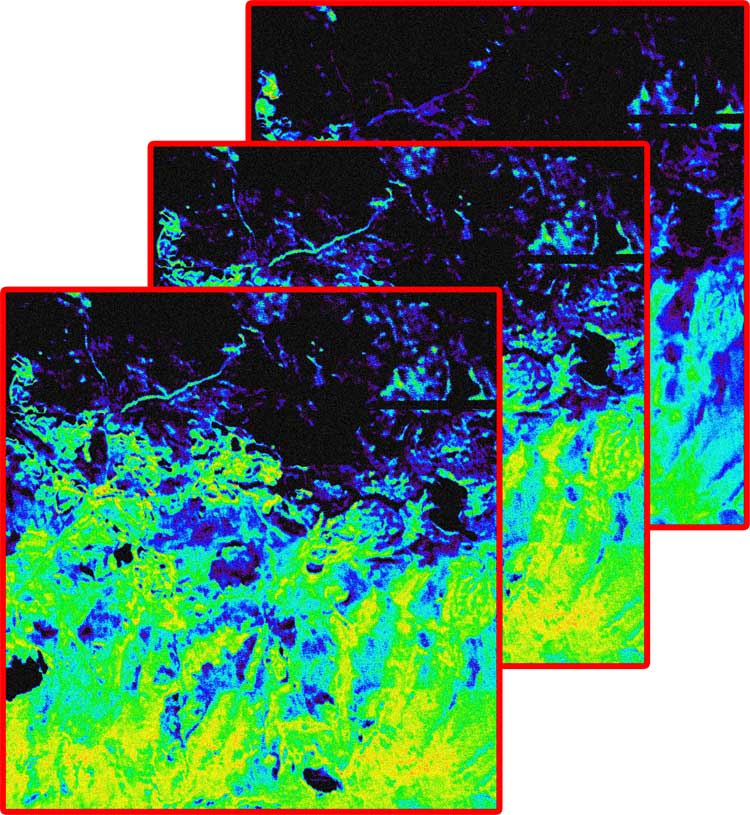
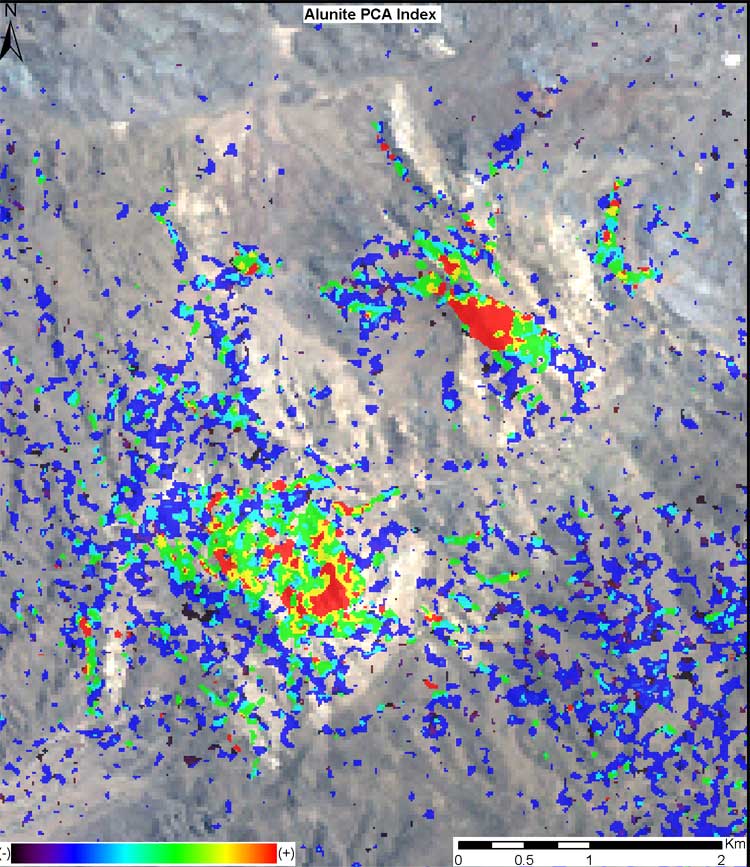
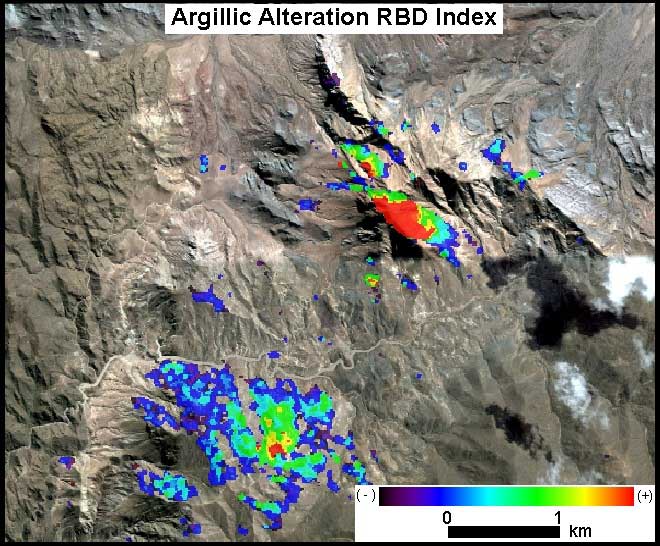
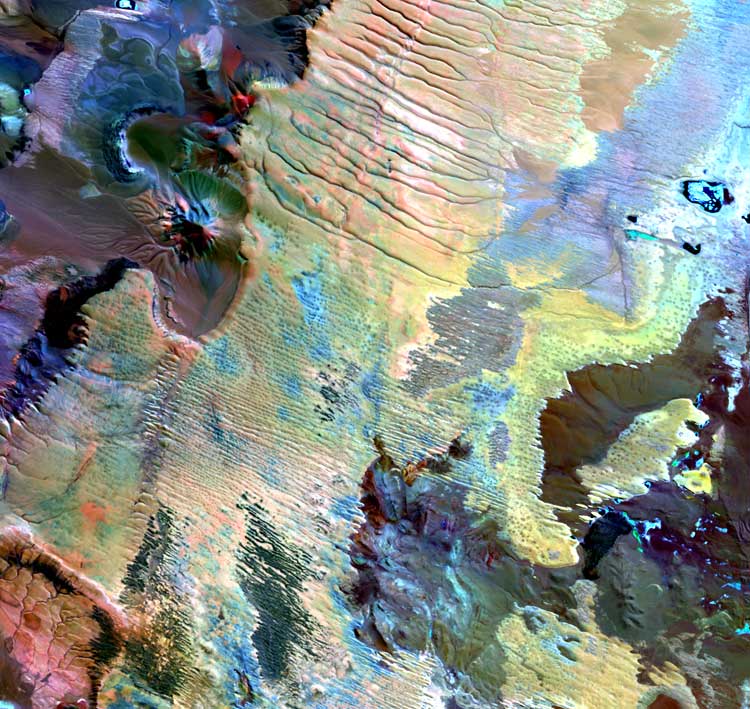
Through the measurement of hyperspectral signatures, it is possible to identify the mineral components of the rocks and their relative abundances. This information can be obtained with the application of our hyperspectral spectrophotometer directly on the outcrops, or through the samples or core samples in our labs.


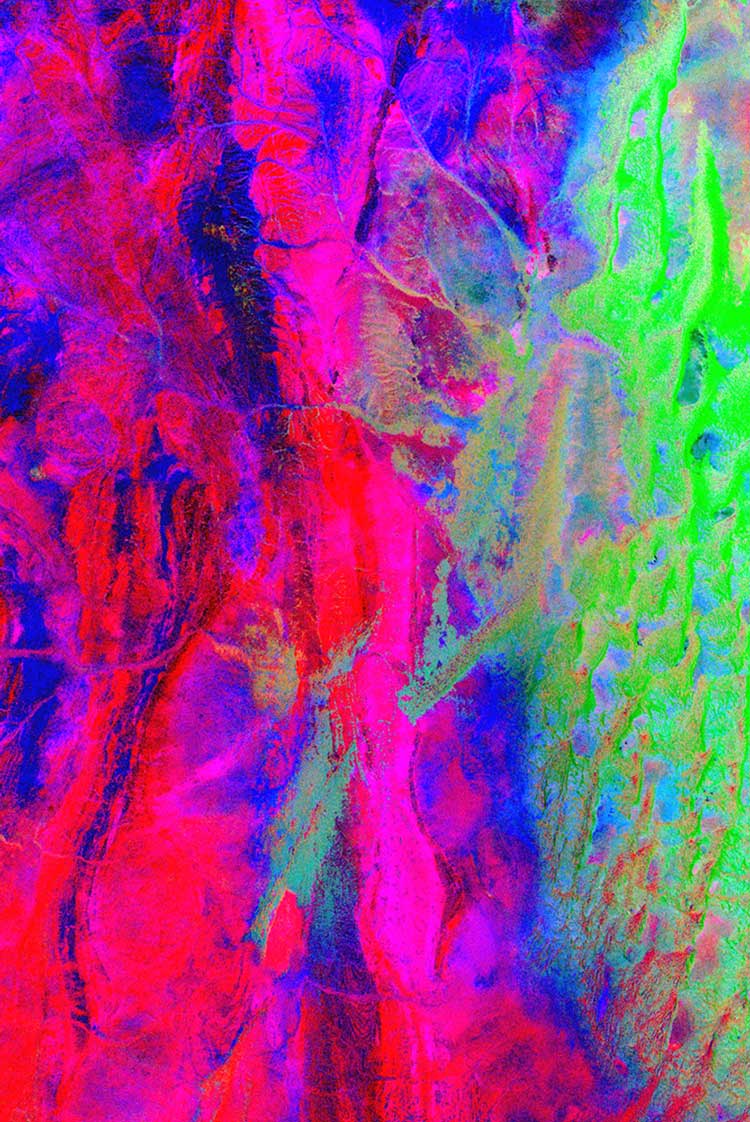
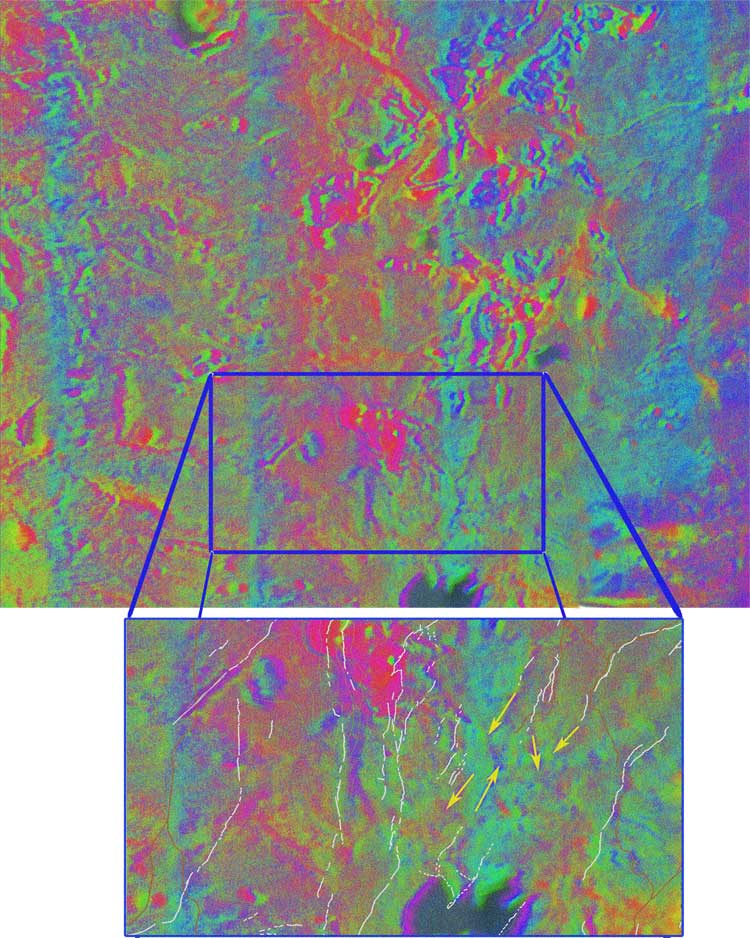
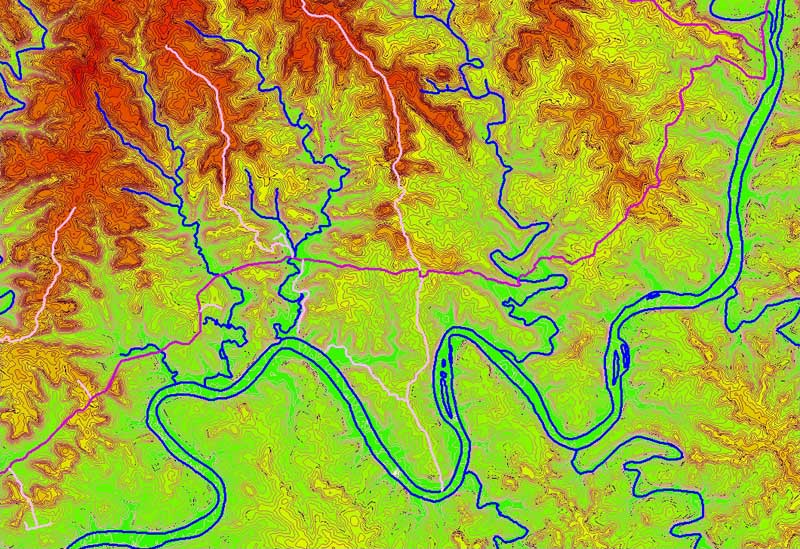
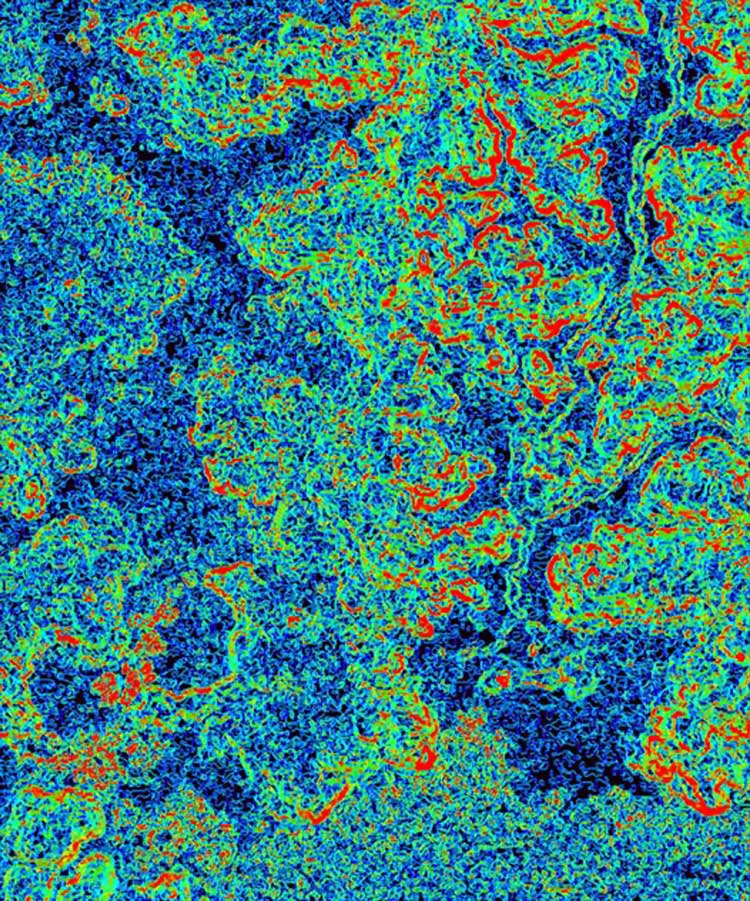
A structural map is the spatial representation of the fragile and/or ductile deformation that affects the crust. The map represents the symmetry and the geometry of surficial forms that resulted from the terrain deformations.

A lineament is a straight or curvilinear structural feature of a terrain. It may also present linear or discontinuous schemes. These lineaments are useful for the definition of regional and subcontinental fractures patterns, and thus reveal the forces that have been acting over large cortical masses throughout the time.

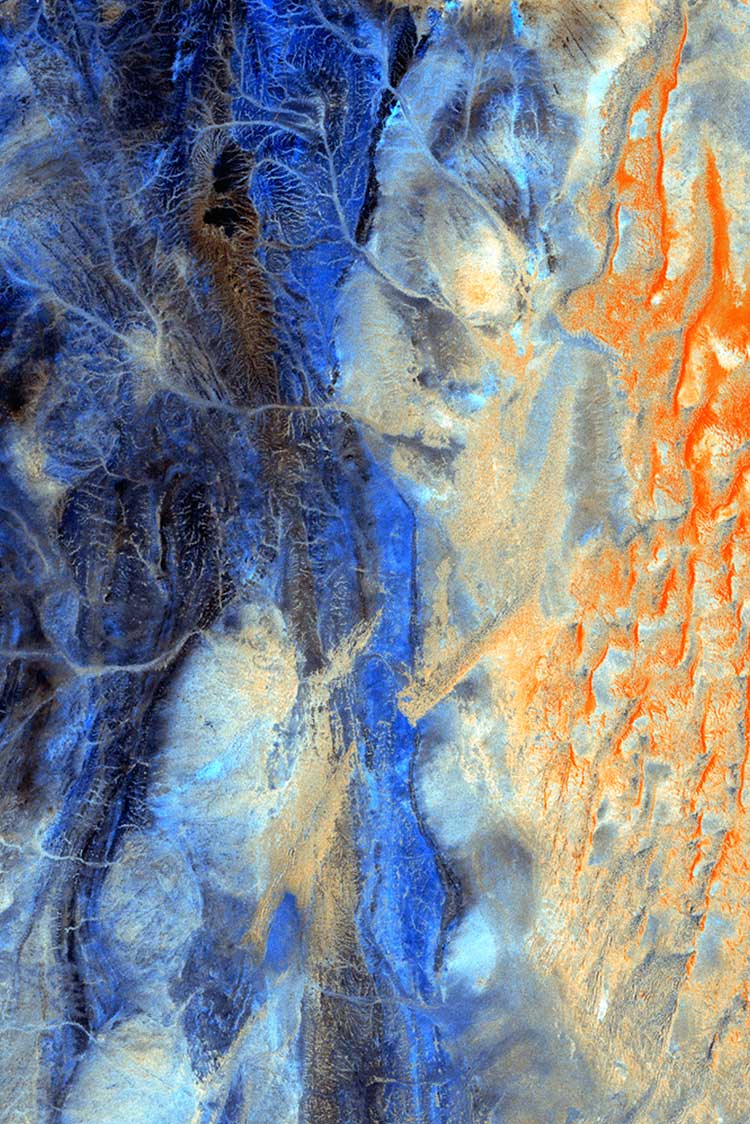
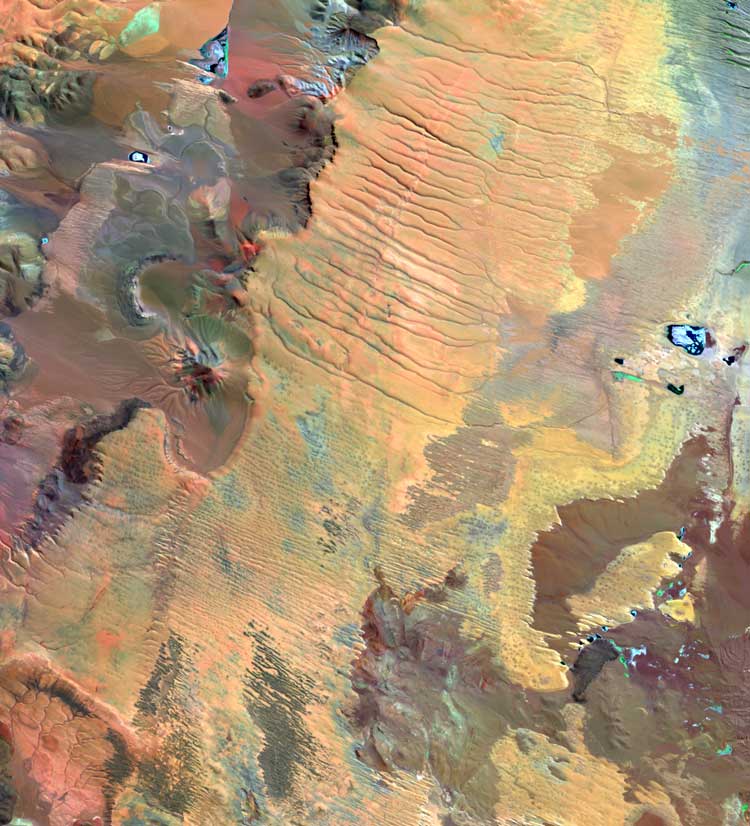
Lithological maps express the rock distribution in a territory and indicate the classification of the type of rock, providing the spatial disposition of the lithology in a region. These maps are very useful, from the economic point of view, since natural resources intervene as primary constituent in the development of human works and activities, both as foundation or as raw material.

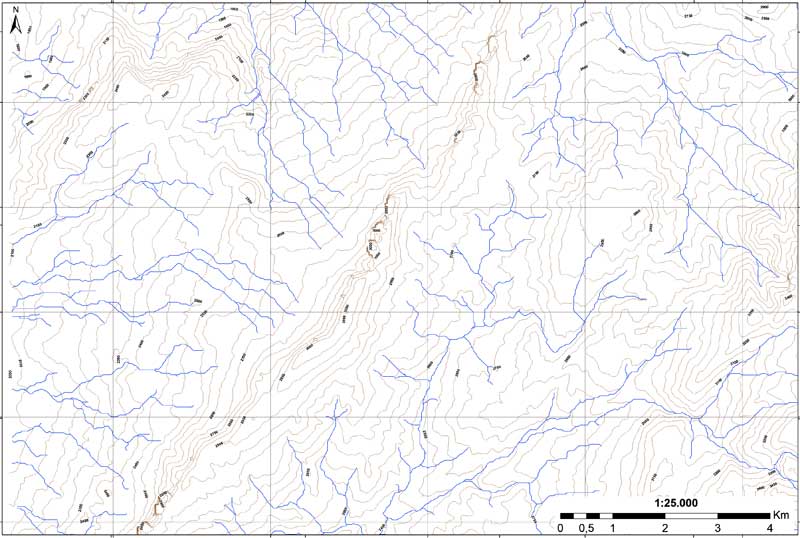
A stratigraphic map is the spatial representation of geological units based on their ages, according to their position in profiles and other spatial relationships.


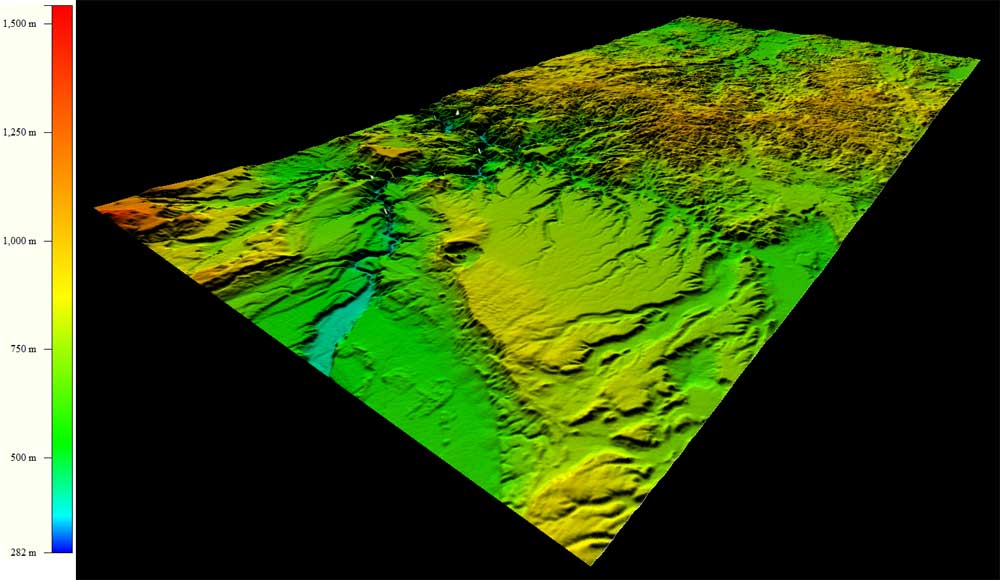
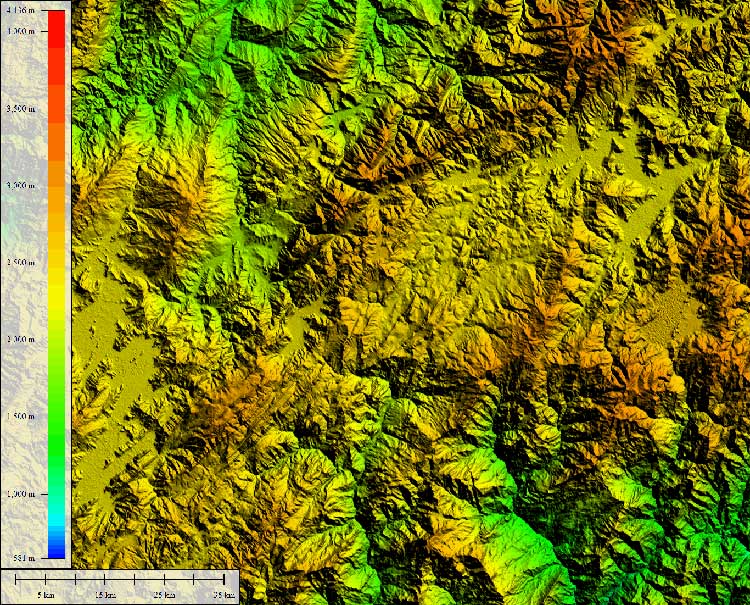
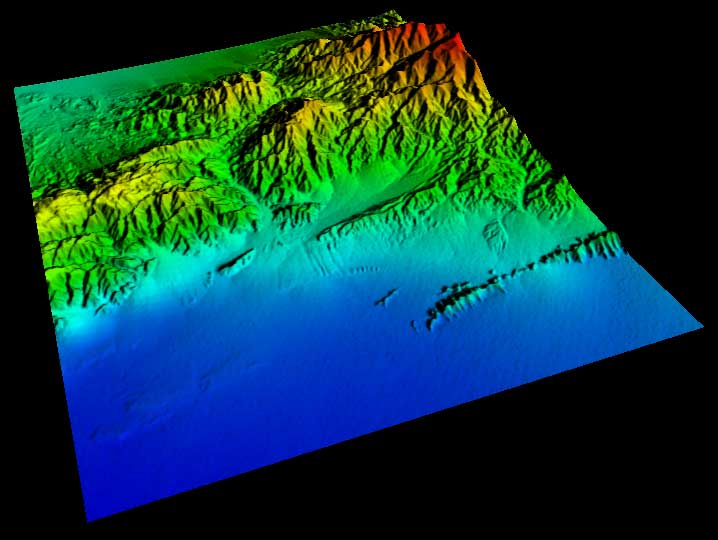
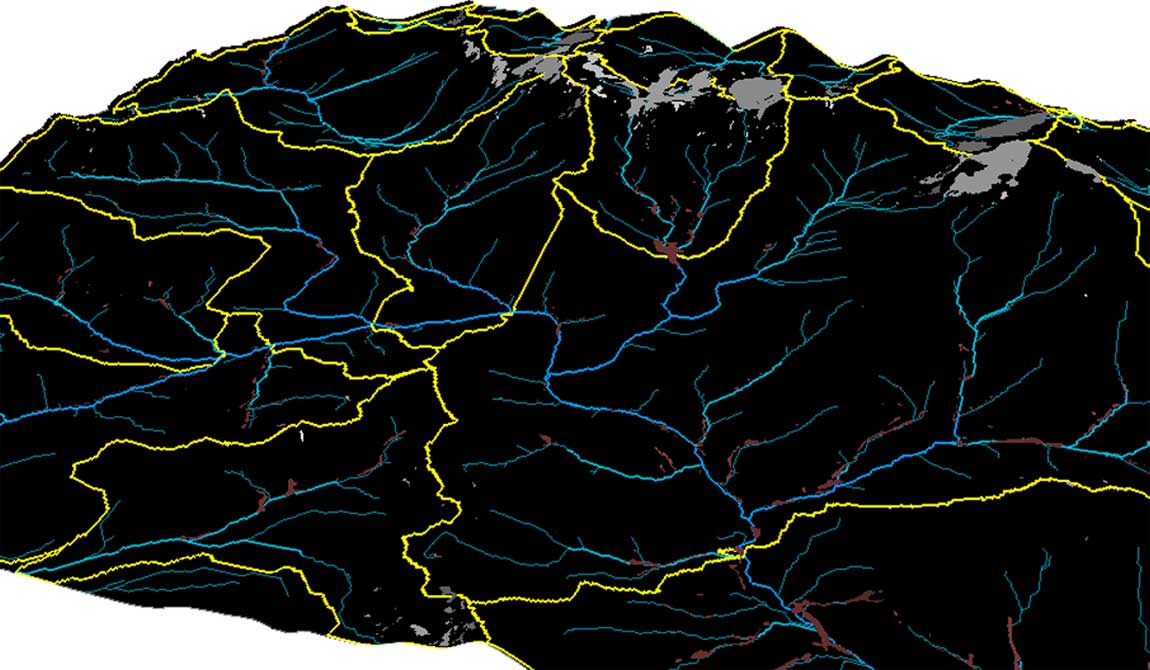
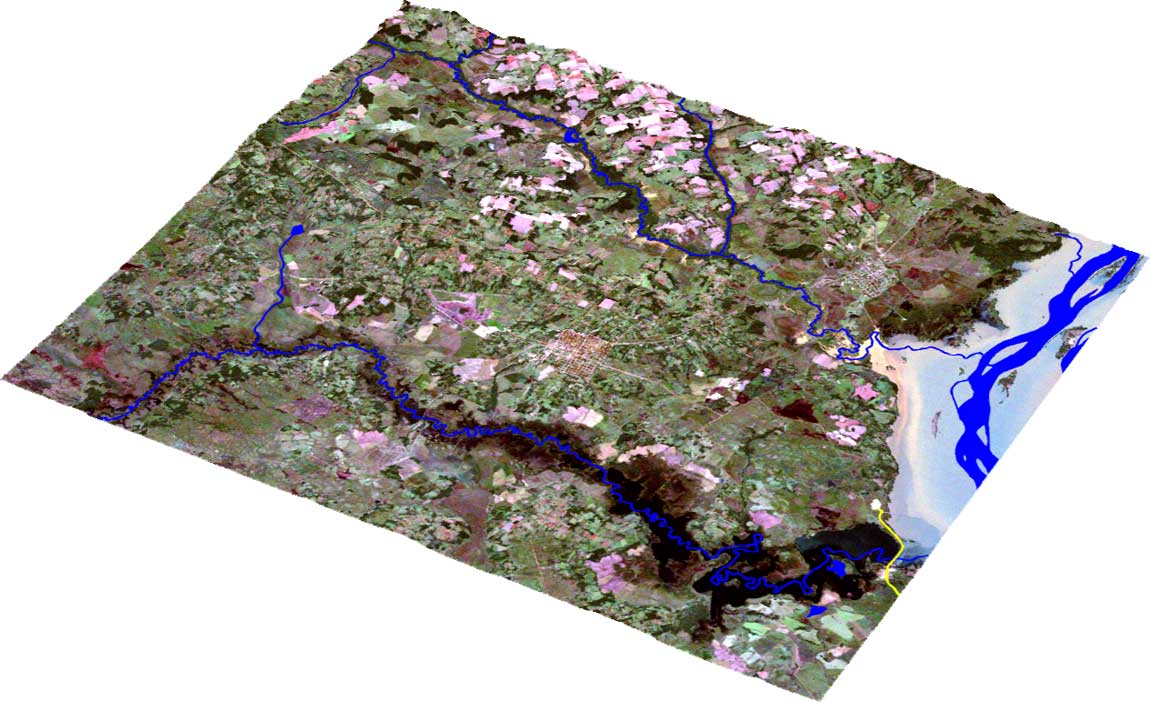
A Digital Terrain Model is the numeric structure of data that represents the spatial distribution of a quantitative and continuous variable. It is obtained from a combination of Digital Elevation Model with the satellite images of the same area.


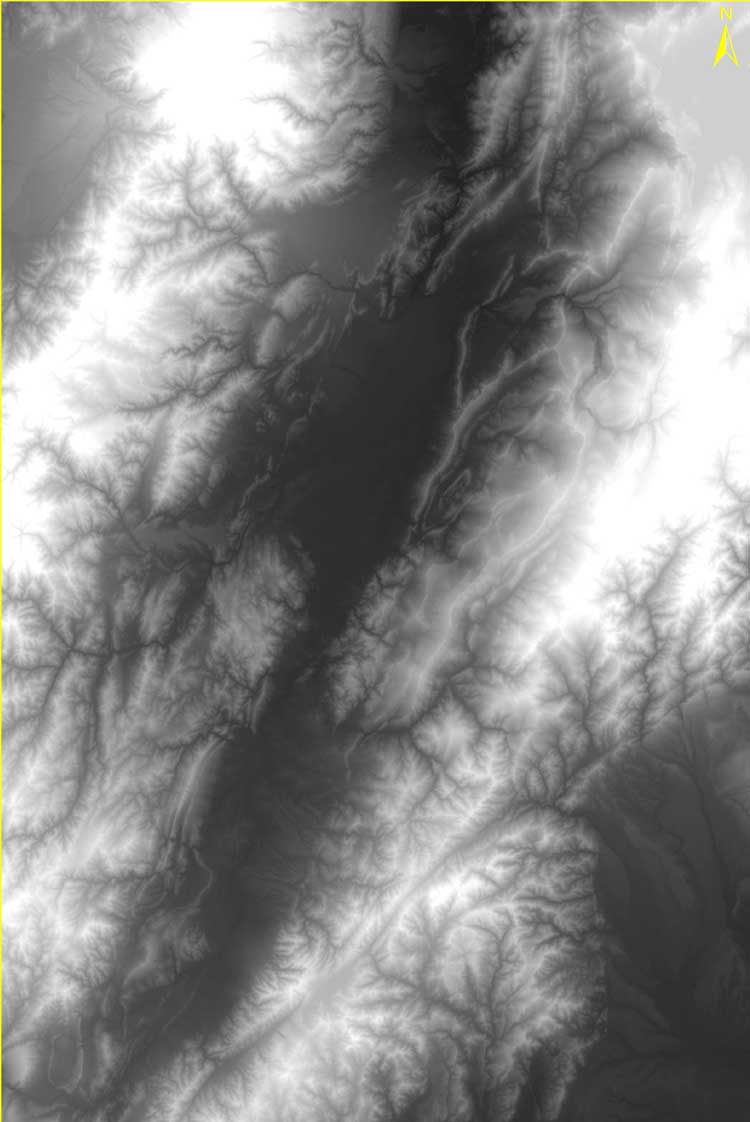
With the implementation of remote sensing techniques, it is feasible to describe, categorize and determine the nature, origin and development of the forms of the current relief, as well as the relationship with the underlying structures. Moreover, it is possible to learn about the geological history registered in the surficial structures.


