
EMERGENCY RESPONSE
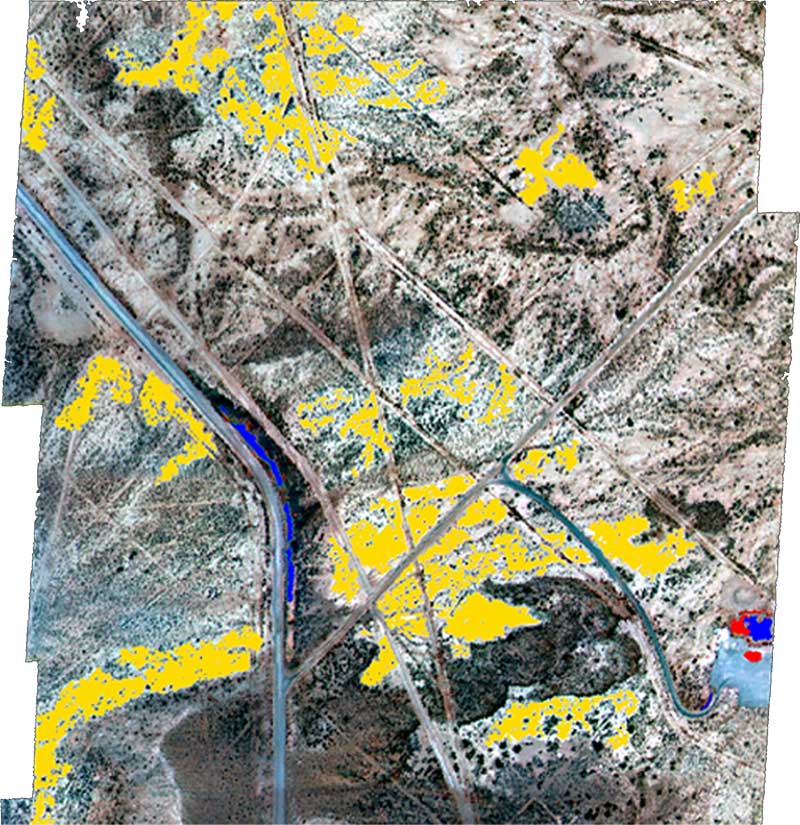
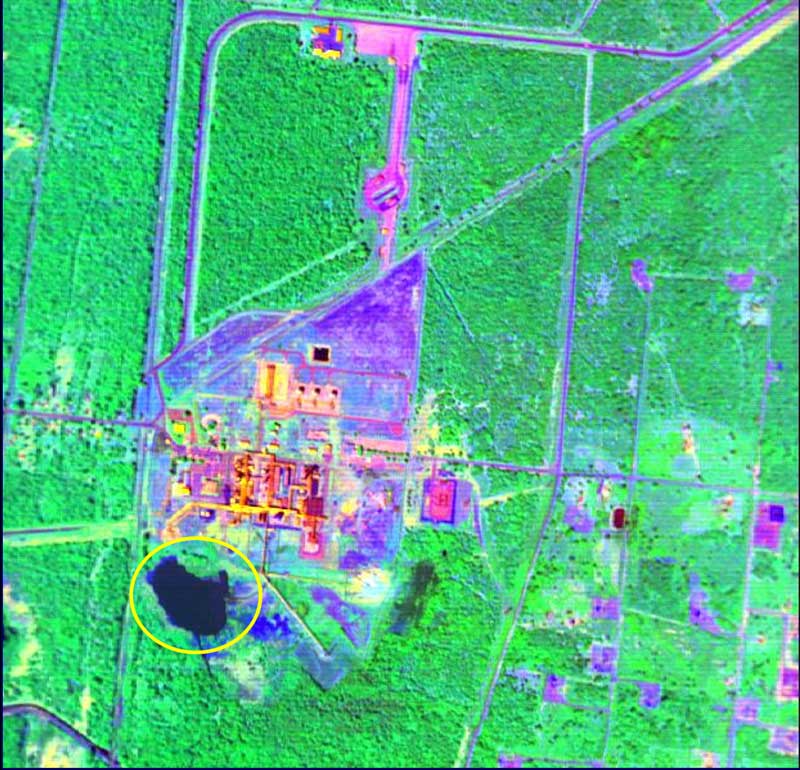
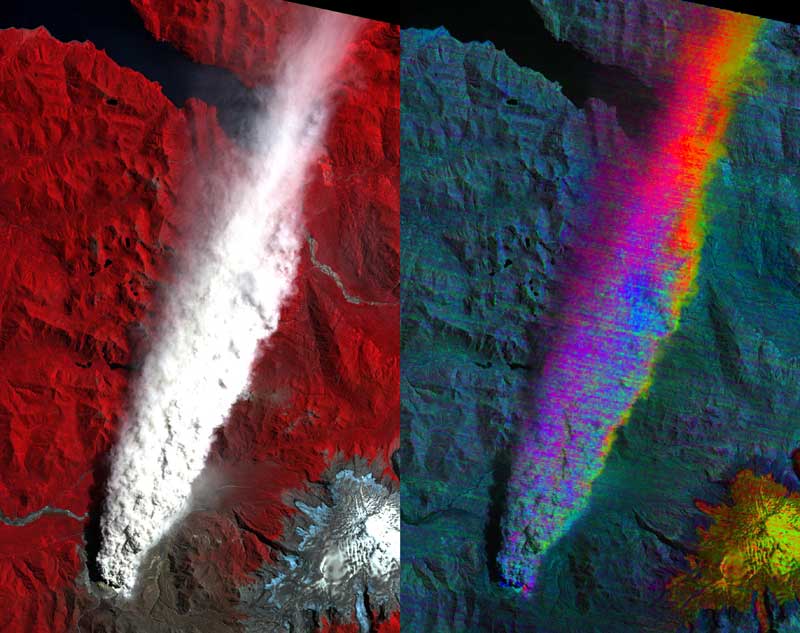
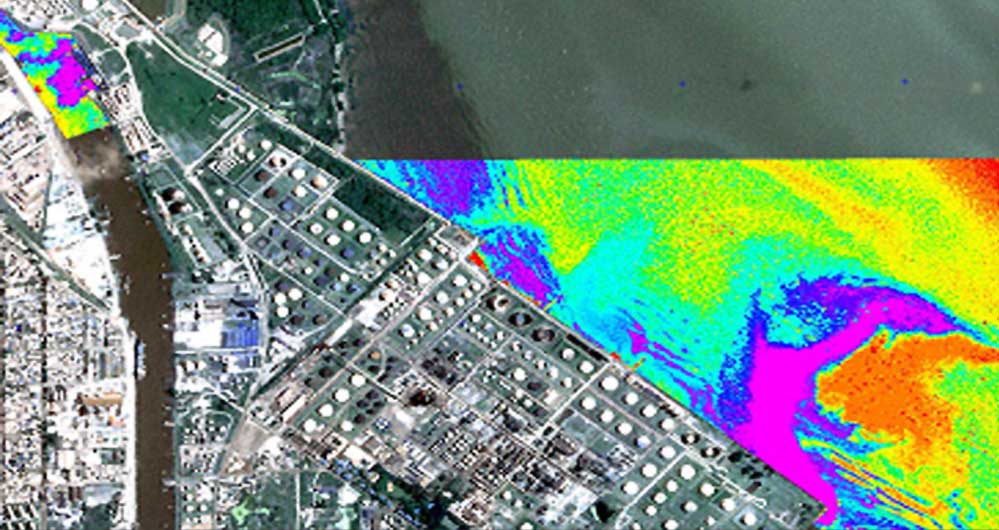
Accidental spills of toxic material, wildfires and natural disasters require immediate action. HytecAltoAmericas’ imagery supplies near real-time information regarding the location and extent of the impact. The consequences of such catastrophic events can also be evaluated using remote sensing.
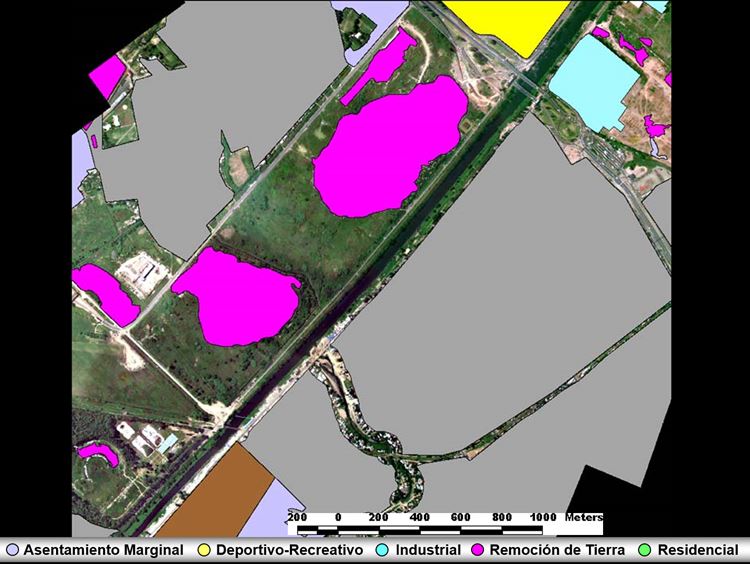
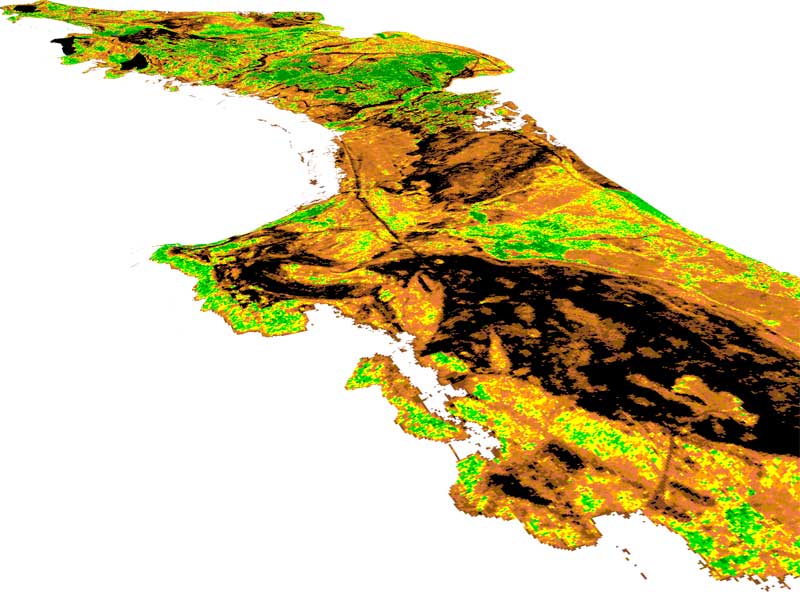
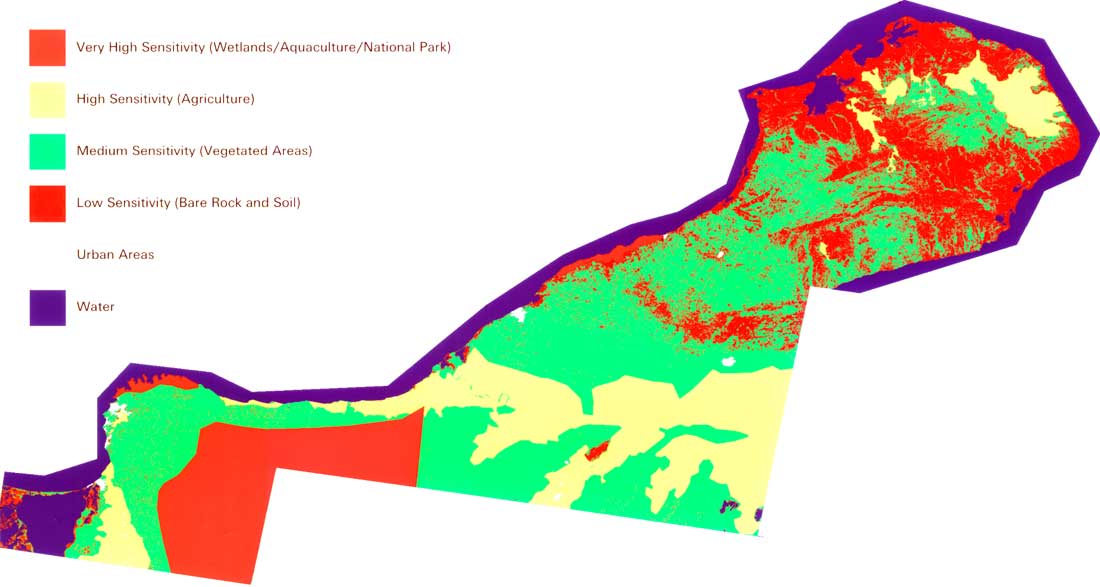
This product maps the extension and levels of damage on any area due to natural occurring disasters such as earthquakes, flows, twisters, volcanic eruptions, wildfires, etc. Agricultural and material losses are also estimated.


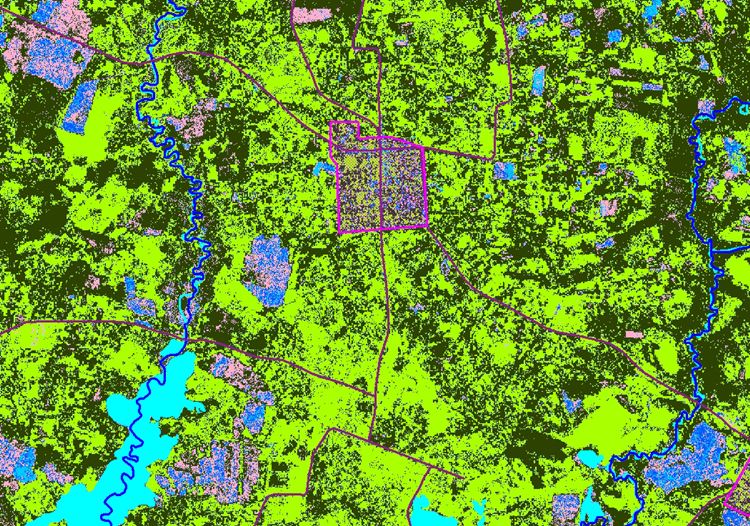
A population density map records population estimates that are not obtained directly, but are inferred by various methods. Dwelling-unit estimates are most useful in rural areas and third world countries. Land use and area density estimates are also used. In large cities, built-up techniques can be utilized.


This map details the location of different services network and its respective facilities. It can include, for example, electric lines, microwaves transmission towers, irrigation canals, water pipe, oil and gas pipelines, cloaca, etc.

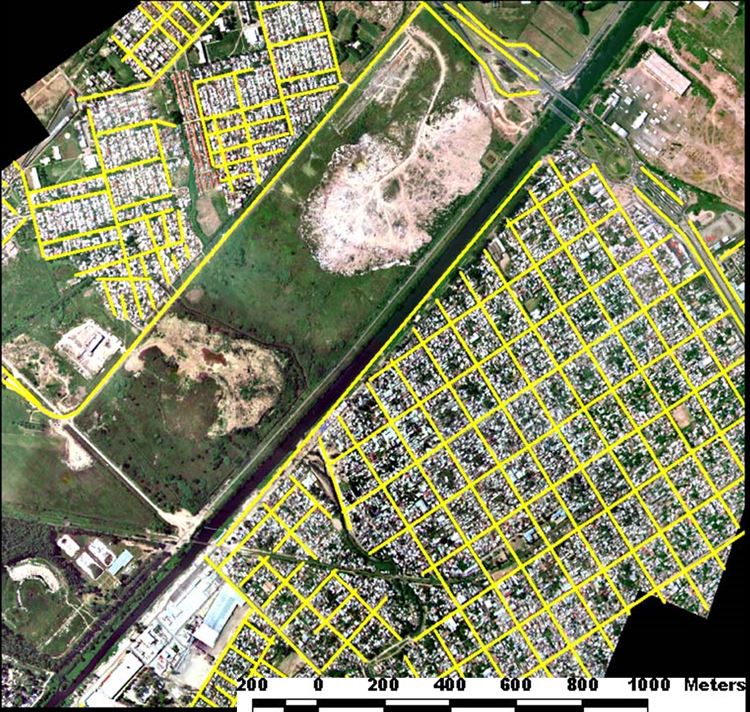
All types of roads, both urban and regional, are registered in the road map: highways, avenues, streets, alleys, railways, paved roads, gravel or dirt road, etc.
An accessibility or transitability map is developed from soil, lithological transportation network maps, and also from slope analysis. These maps show the ease of moving equipment and personnel from one location to another.
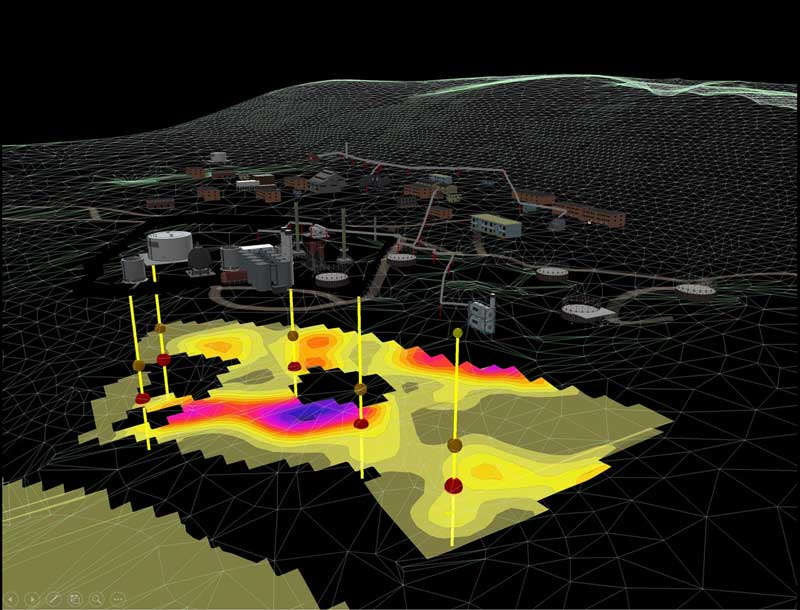
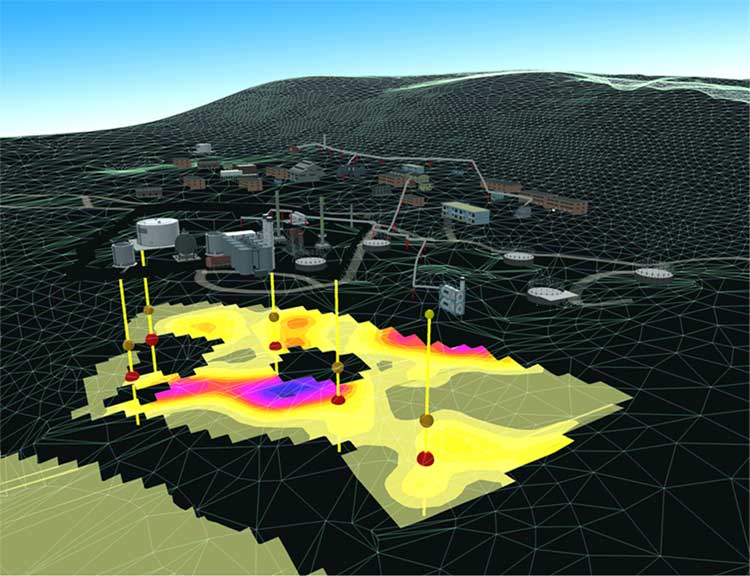
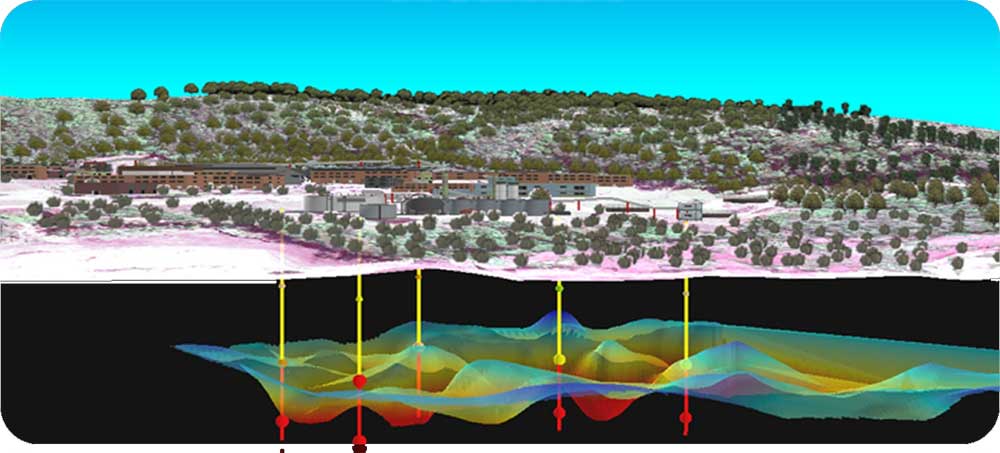
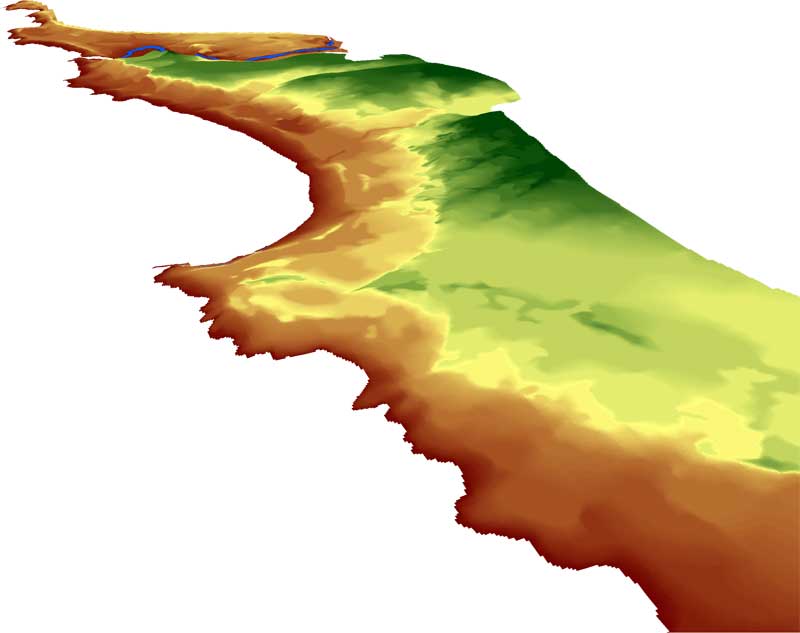
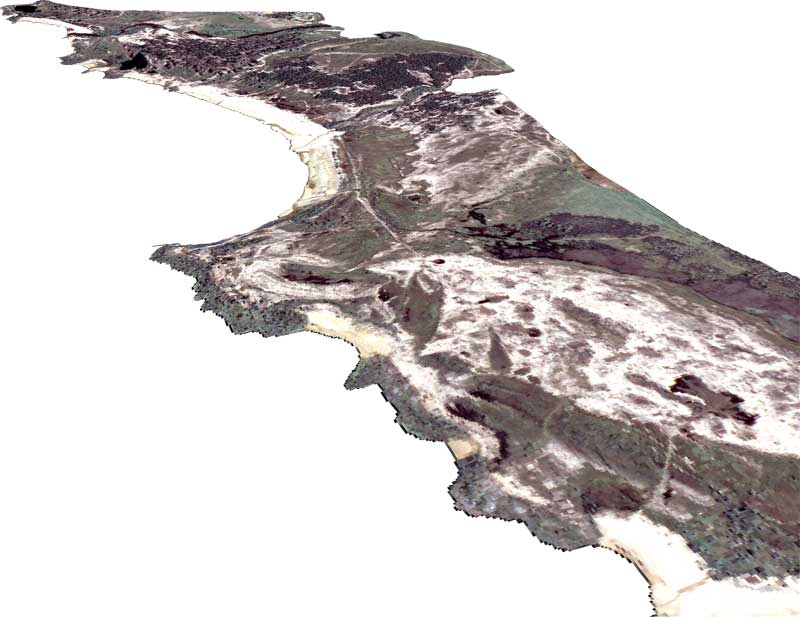
A DTM is derived from the combination of a digital elevation model with the corresponding surface images. Such a model allows to visualize the terrain features in 3-D.

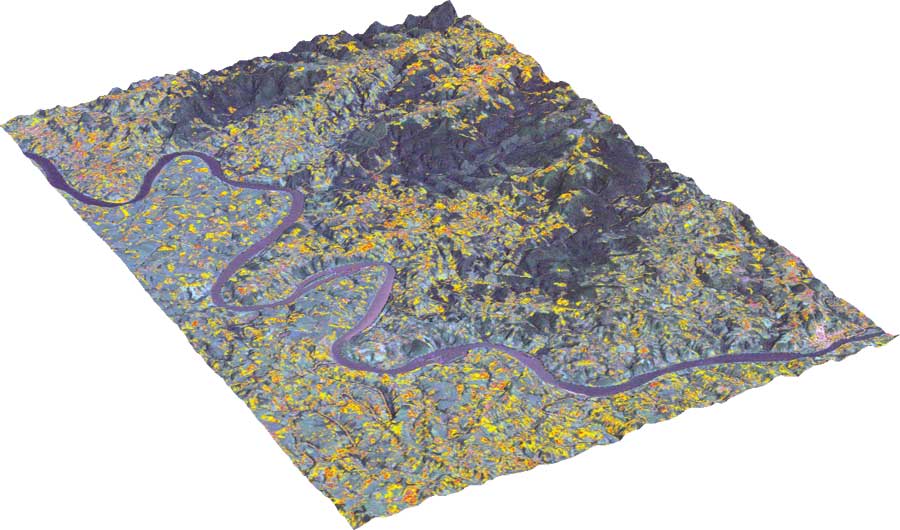
A surface stability analysis is developed from soil and lithological maps, and slope analysis core products. These composite maps are useful to civil engineers in the planning of dams and general infrastructure, and for pipeline, channel, and transportation network routing.


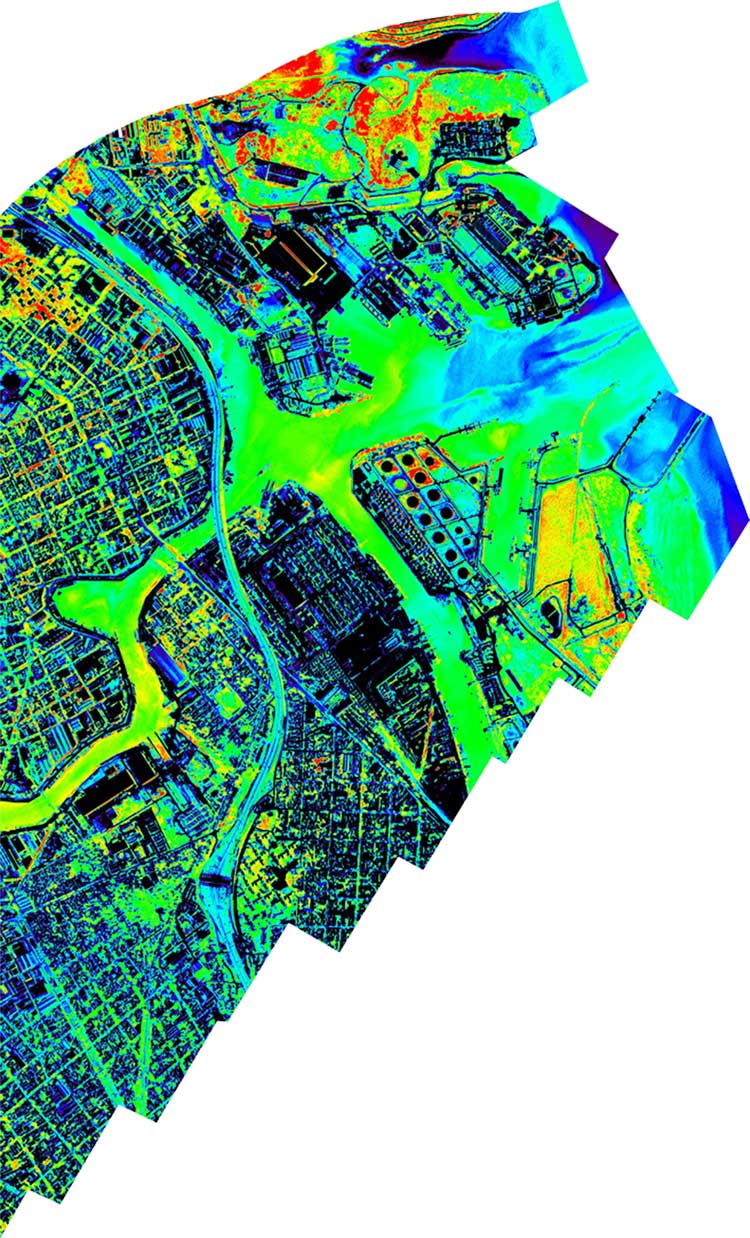
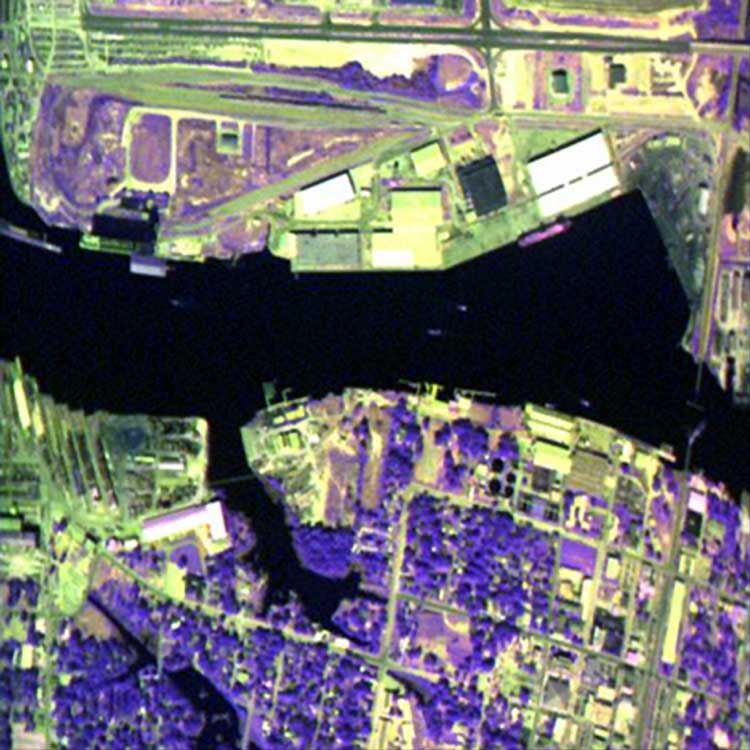
Emissivity in imagery can be adjusted to brightness temperature scales.


