

OIL & GAS
On-Shore Exploration
A Prospectivity Map is defined as the final product of the integration of the data acquisition, processing and interpretation during the different stages of a project. The categorization and weighting are included, which are defined by the information obtained through different multispectral and hyperspectral interpretation techniques, structural maps, etc. A prospectivity scale of the different targets is made after the final weighting.
Due to the progress of the Geographic Information Systems during these last years, the development of prospection projects without a geolocated database became unthinkable. These Prospectivity Maps can be improved with information provided by the client, such as structural and isopach maps, seismic profiles or cubes, geochemical data, etc.
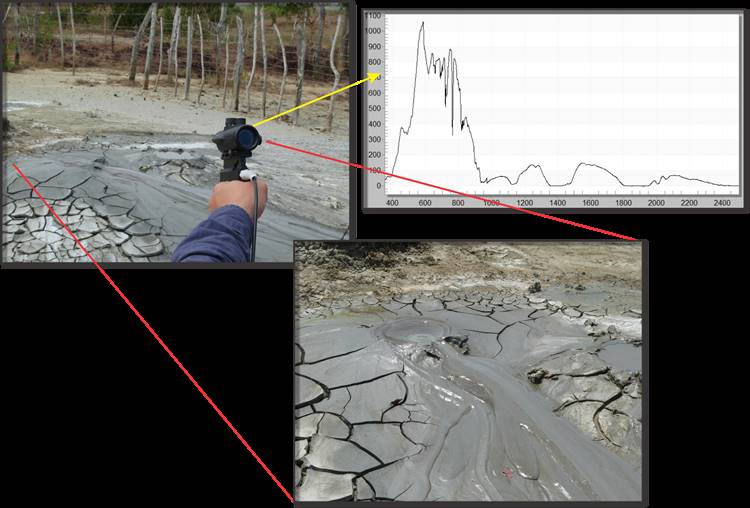
The natural emanations of gas and oil has always provided valuable information to oil explorers in frontier areas in order to identify and evaluate sedimentary basins. These emanations indicate the presence of hydrocarbon source rocks in depth.
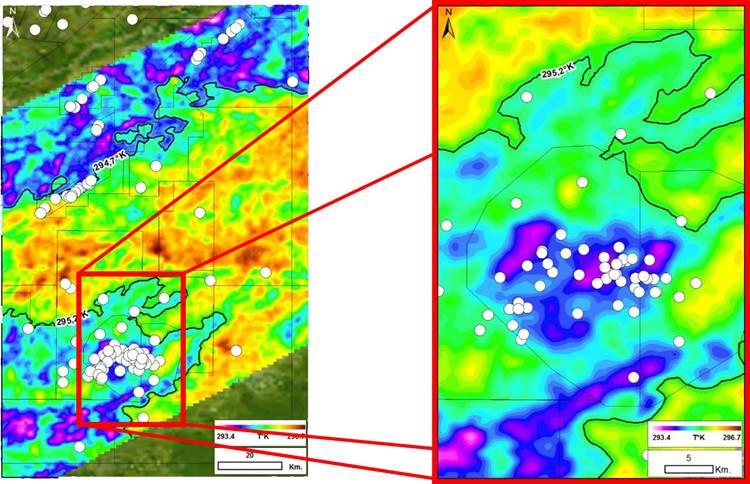
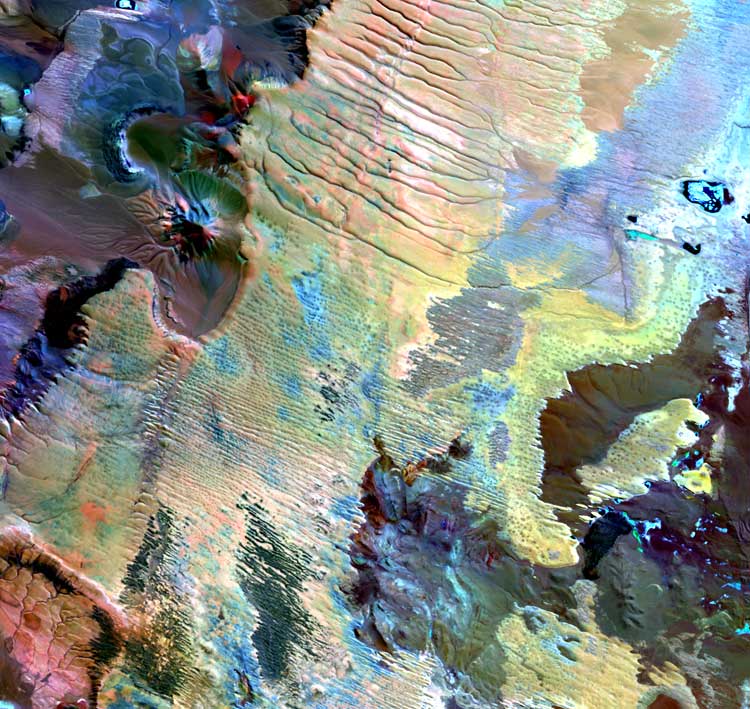
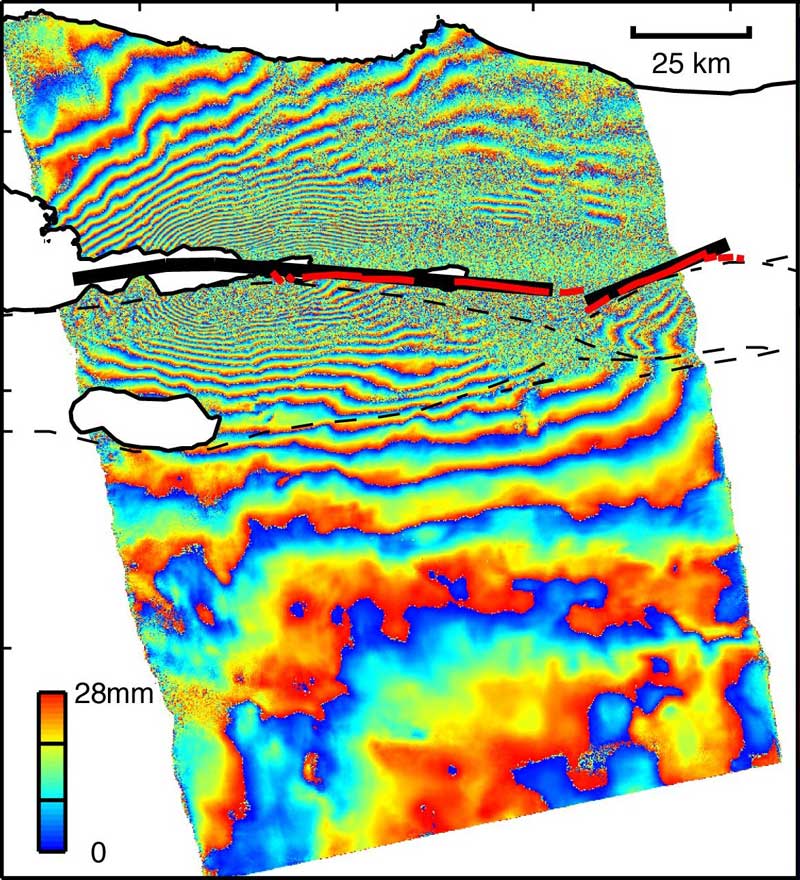
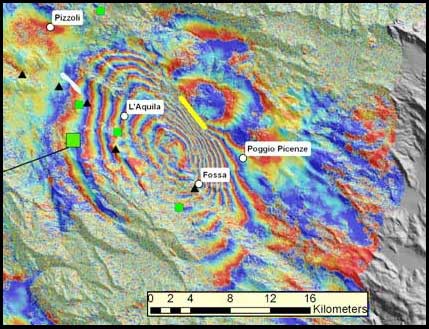
Those natural emanations of hydrocarbons can be identified through the processing and interpretation of radar and hyperspectral images. These types of images allow the differentiation and definition of the localization and the size of the surficial manifestation of hydrocarbons in a certain exploratory block.


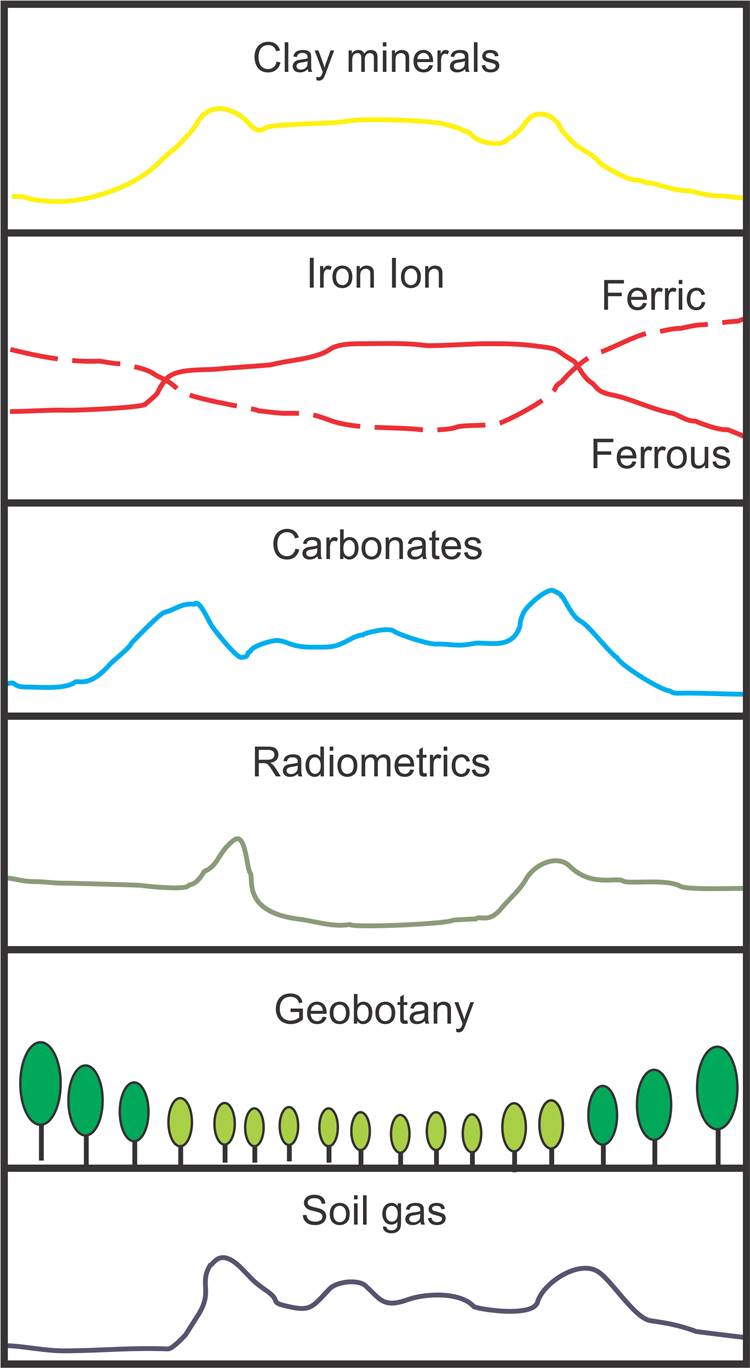
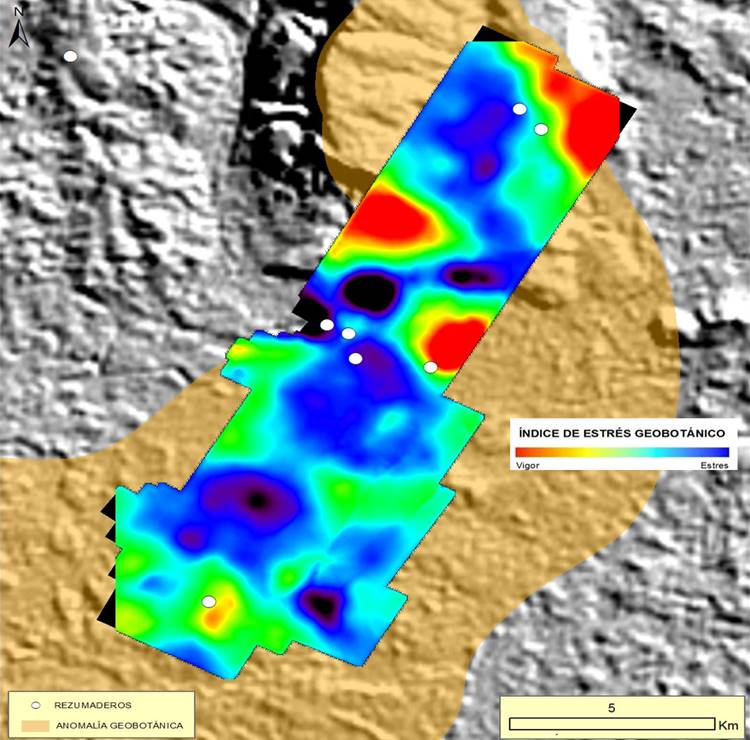
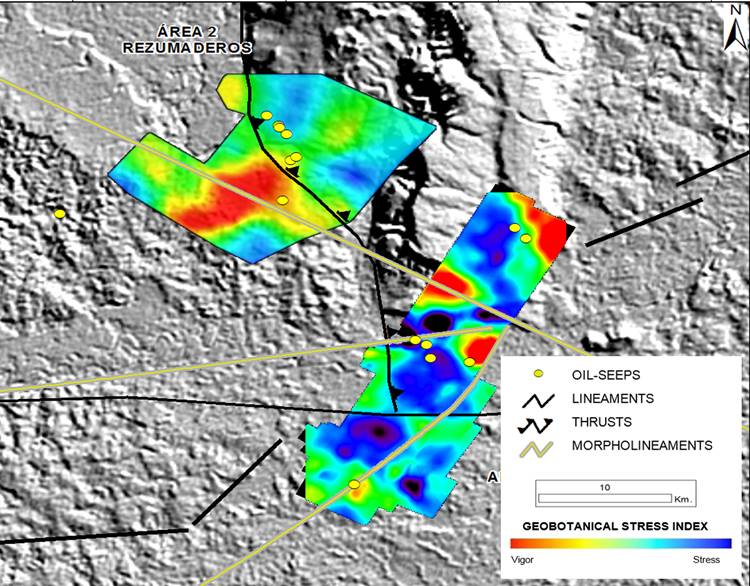
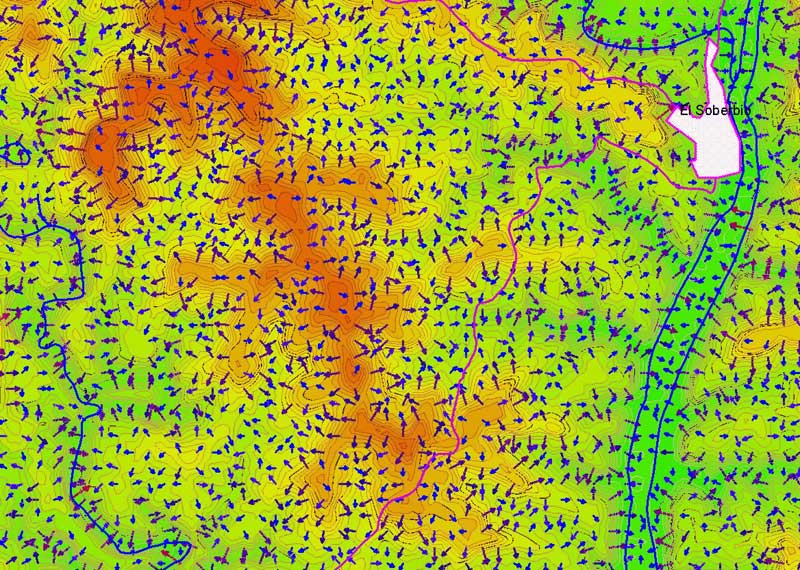
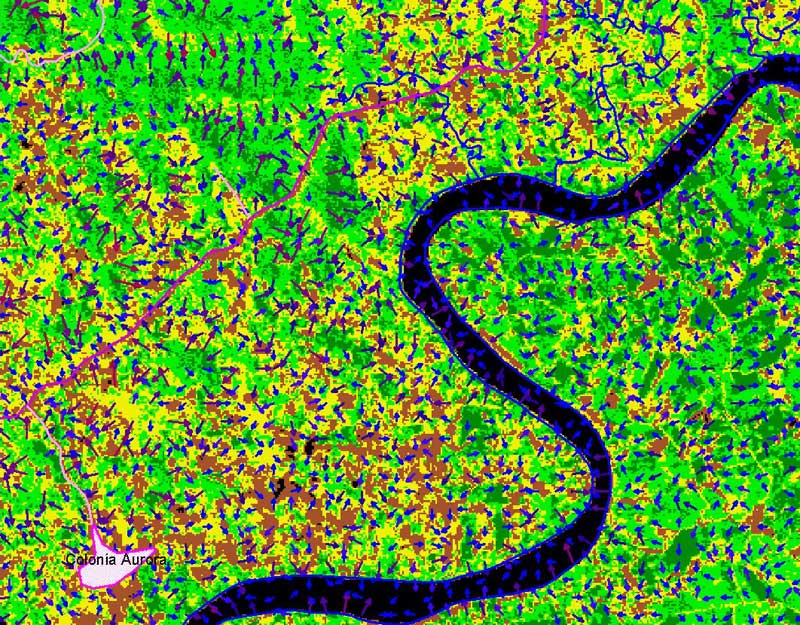
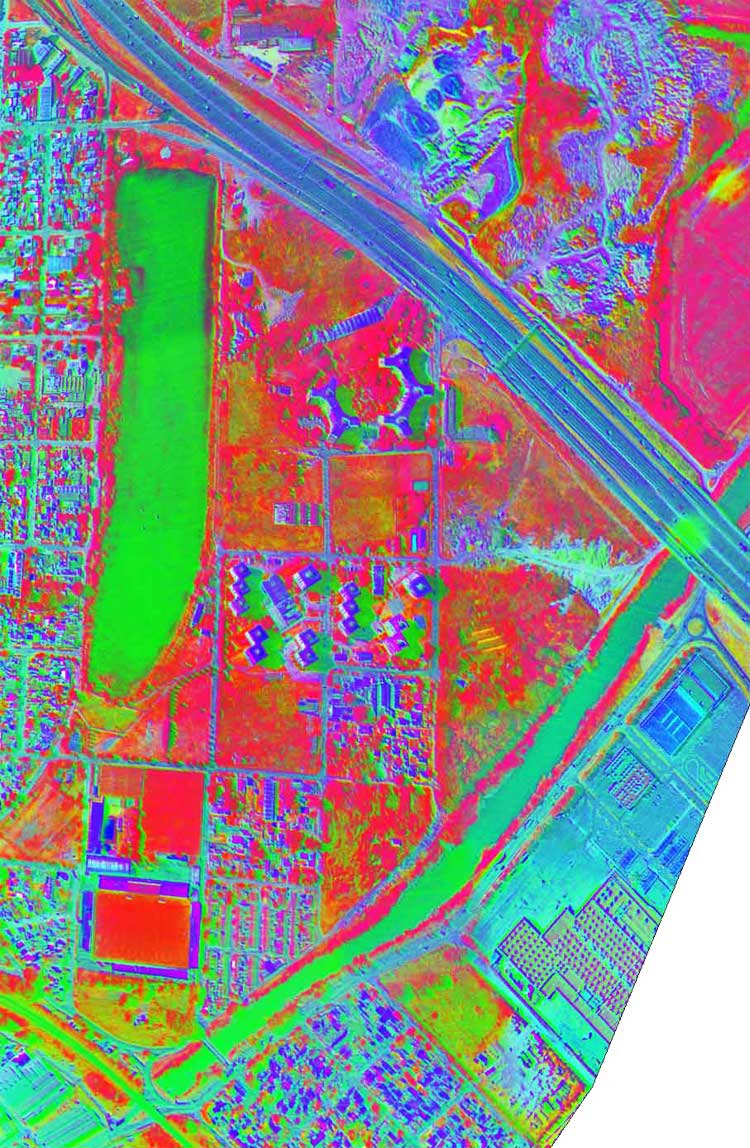
The migration of light hydrocarbons to the surface generates a great variety of changes in the environment, which results in the establishment of anaerobic and reducing conditions, together with changes in the pH of the soil. These factors affect the growth and the state of the vegetation, which can be detected through multispectral and hyperspectral images, and then turned into a map of vegetation spectral anomalies.


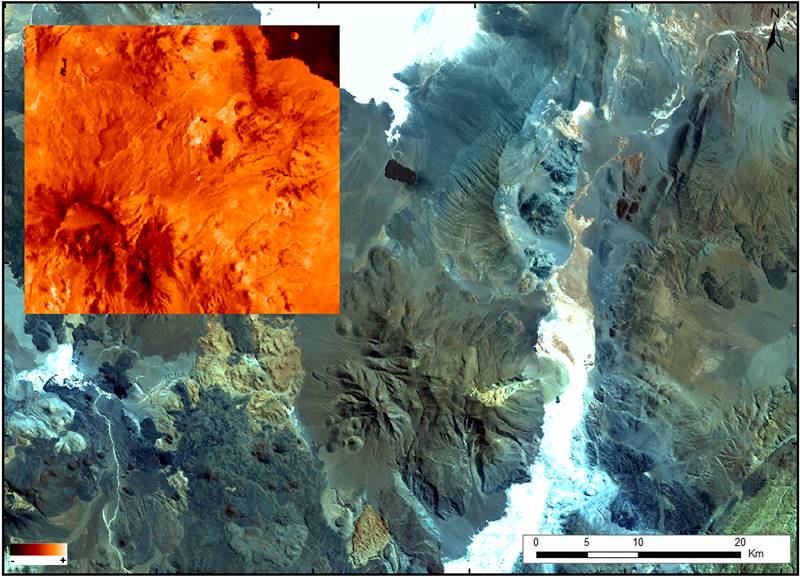
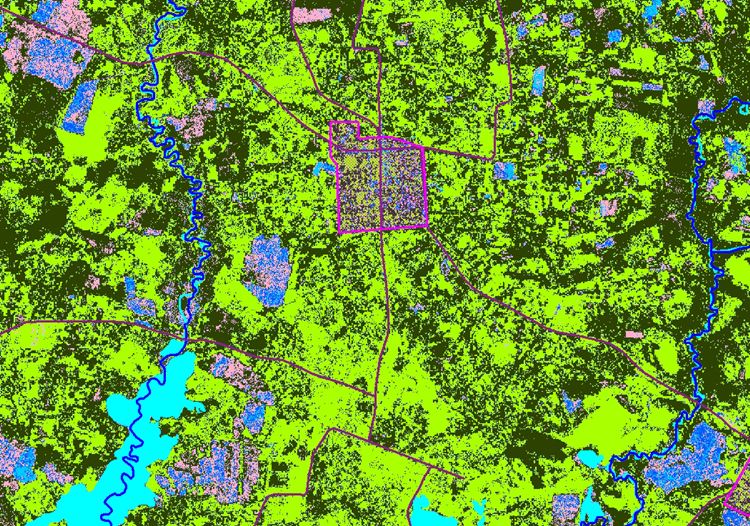
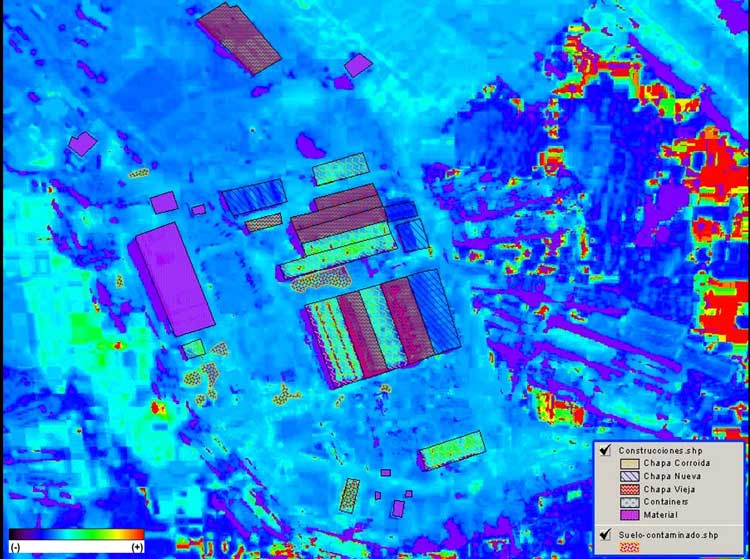
The remote detection of minerals and groups of minerals is a highly useful tool in the hydrocarbons exploration. A mineral spectral anomalies map is based on the power of mineralogical discrimination that multispectral and hyperspectral images possess. These maps represent surficial alteration areas that can be caused by hydrocarbon migration.


A stratigraphic map is the spatial representation of geological units based on their ages, according to their position in the profiles and in other spatial relationships.

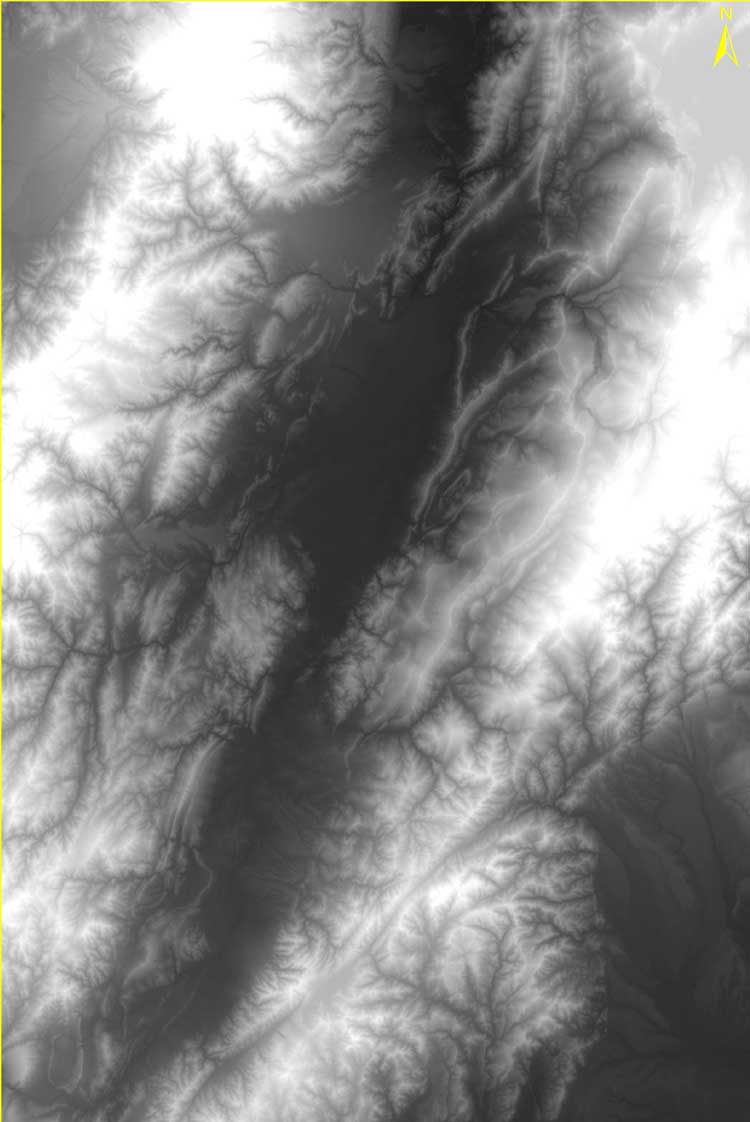
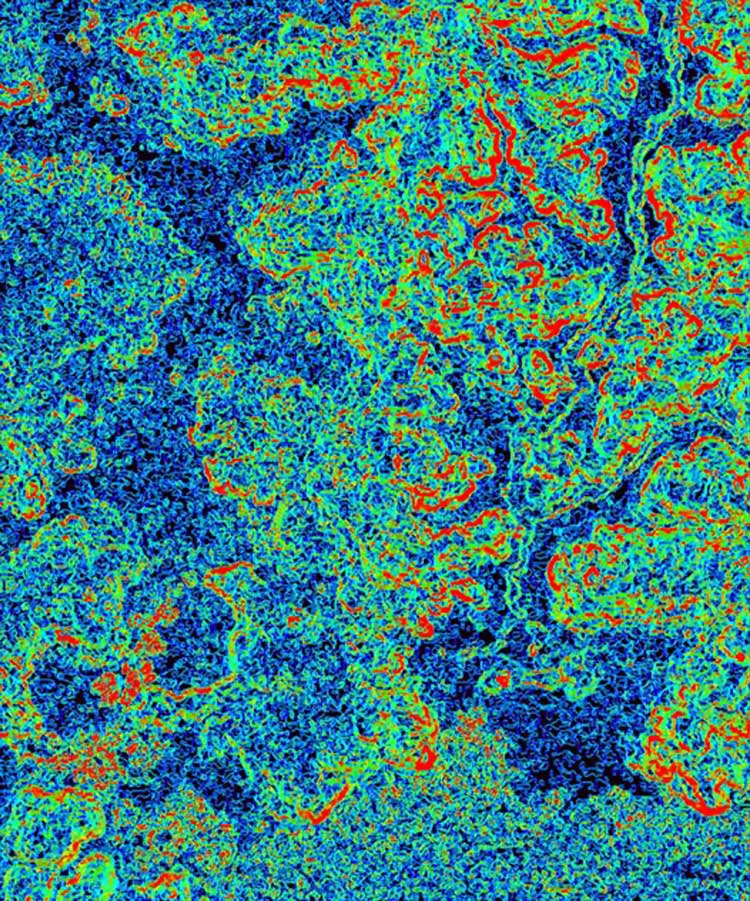
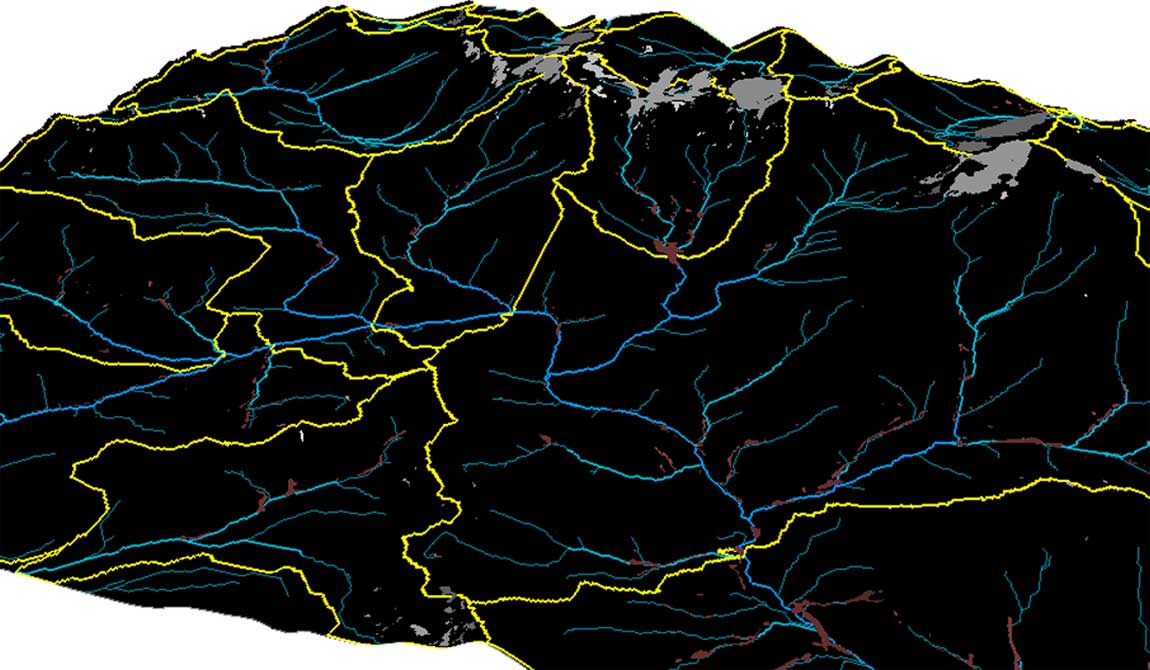
A structural map is the spatial representation of the fragile and/or ductile deformation that affects the crust. It presents the symmetry and geometry of the surficial forms resulting from the terrain deformation.

A lineament is a straight or curvilinear structural feature of a terrain. It may also present linear or discontinuous schemes. These lineaments are useful for the definition of regional and subcontinental fractures patterns, and thus reveal the forces that have been acting over large cortical masses throughout the time.


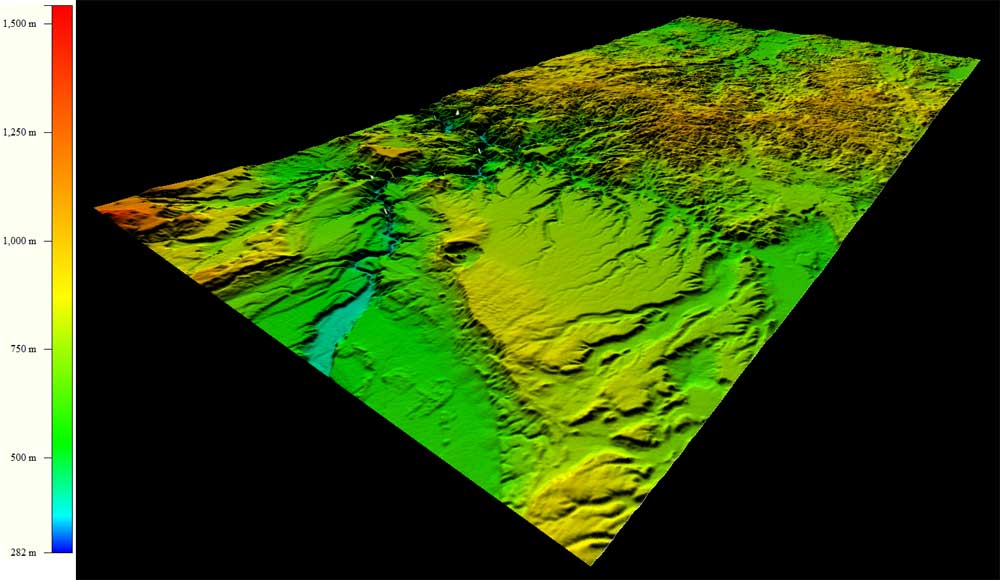
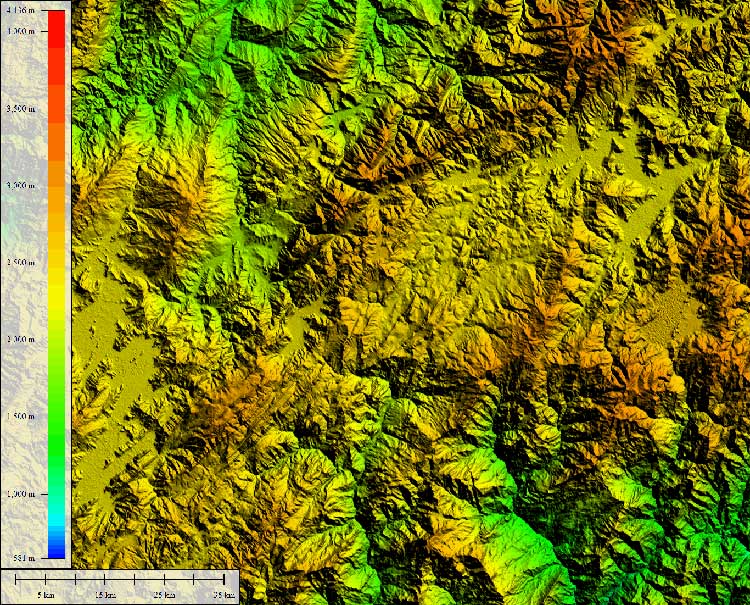
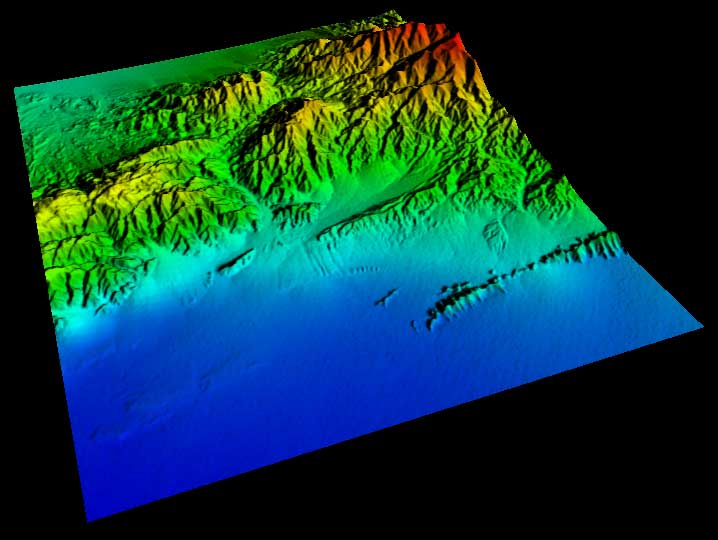
A Digital Terrain Model is the numeric structure of data that represents the spatial distribution of a quantitative and continuous variable. It is obtained from a combination of Digital Elevation Model with the satellite images of the same area.

With the implementation of remote sensing techniques, it is feasible to describe, categorize and determine the nature, origin and development of the forms of the current relief, as well as the relationship with the underlying structures. Moreover, it is possible to learn about the geological history registered in the surficial structures


Soil, lithological and slope maps are analyzed in order to obtain helpful data for civil engineers in the projection of dams or infrastructure in general, as well as the layout of pipes, canals and roads

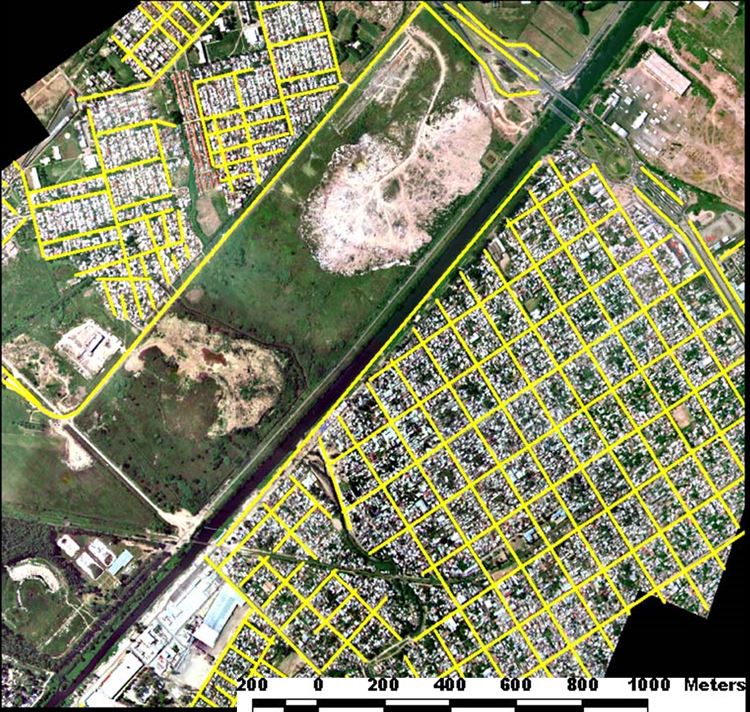
All types of roads, both urban and regional, are registered in the road map: highways, avenues, streets, alleys, railways, paved roads, gravel or dirt road, etc.
A transitability survey indicates the ease to mobilize personnel and equipment from one place to another. It is the result of the analysis of the transport network of the region, as wells as soil, lithology, scope, hydrography and the type of vegetation.


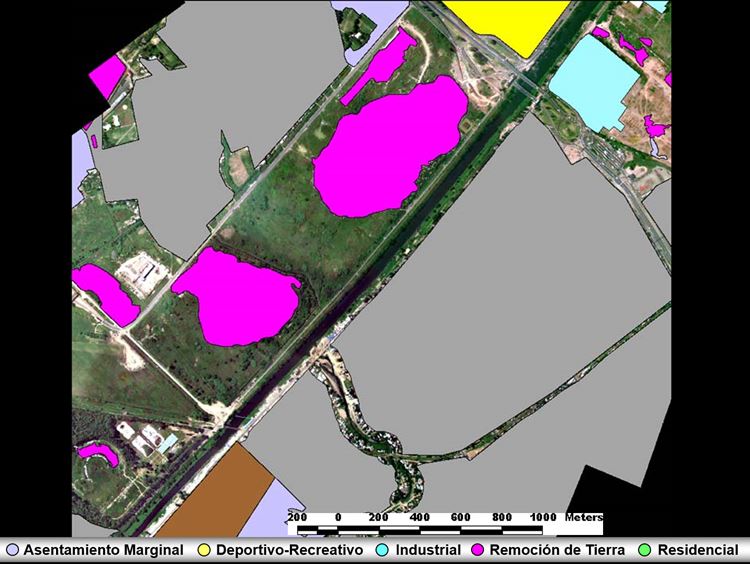
This map registers the population density indirectly. For instance, the population of a region can be estimated through the count of the houses, inferring the amount of persons that compose a typical family according to a rural or urban area. There are specific methods for highly urbanized areas that are used for the big cities.

This map can be considered a multitemporal analysis variation. It includes the mapping of urban areas, as well as the comparison with previous data, in order to identify changes and know the urbanization rate.


